Rapid and Sensitive High-Performance Liquid Chromatography/Tandem Mass Spectrometry Method for Determination of Danshensu in Rat Plasma
Abstract
A sensitive, specific and rapid high-performance liquid chromatography/tandem mass spectrometry (hplc–ms/ms) method has been developed and validated for the determination of danshensu (dss) in rat plasma in the present study. The analytes were separated on a c18 column (50 mm×2.1 mm, 1.7 μm) and a triplequadrupole mass spectrometry equipped with electrospray ionization (esi) source was applied for detection. The simple protein precipitation was applied to extract dss from the plasma (about 80%). The method was linear over the concentration ranges of 50–1000 ng/ml for dss. The lower limit of quantitation (lloq) of dss was 50 ng/ml. The intra-day and inter-day relative standard deviation (rsd) were less than 15% and the relative error (re) were all within 15%. Finally, the method was successfully applied to support the pharmacokinetic study after guanxinsu solution was orally administrated to the sprague–dawley rat, respectively.
Author Contributions
Academic Editor: Leonid Tarassishin, Associate, Department of Pathology, Albert Einstein College of Medicine, NY
Checked for plagiarism: Yes
Review by: Single-blind
Copyright © 2013 Jin-qian Wang, et al
 This is an open-access article distributed under the terms of the Creative Commons Attribution License, which permits unrestricted use, distribution, and reproduction in any medium, provided the original author and source are credited.
Competing interests
The authors have declared that no competing interests exist.
Citation:
Introduction
Radix Salviae Miltiorrhizae (Danshen in Chinese) is one of the most popular herbs used in many traditional Chinese medicines that have been commonly applied for promoting blood circulation to remove blood stasis, relieving vexation, nourishing the blood and cooling the blood to relieve carbuncles.1, 2, 3Danshensu extracts contains both hydrophilic components (danshensu (DSS), protocatechuicaldehyde and salvianolic acid B, etc.) and lipophilic components (tanshinone I, tanshinone IIA and cryptotanshinone, etc). It was reported that plasma and urinary DSS are promising pharmacokinetic (PK) marker for some traditional Chinese medicines containing DSS.4
Therefore, it is important to determine DSS in the biological samples in order to evaluate the quality of the danshen-contained medicines. Some reversed-phase HPLC and TLC methods have been developed for the determination of DSS.5, 6Recently, Some analysis method based on liquid chromatography coupled with tandem mass spectrometry (LC–MS, LC–MS/MS, LC-ion trap MS) were also described for determining DSS in human plasma.7
In the present study, we present a fast, sensitive and selective method for measuring DSS in plasma using ultra-performance liquid chromatography coupled with tandem mass spectrometry (UPLC–MS/MS) based on the previous work. The LLOQ of 50 ng/mL in plasma corresponded to an on-column sensitivity (the quantity of drug injected on the column per injection) of 125 pg DSS, which was low enough to support the PK study of DSS. The sample was prepared with the simple protein precipitation method. The present method was validated and successfully applied to the PK study after the Chinese herbs guanxinsu was orally administrated to the rats.
Materials and Methods
Chemicals and Reagents
Reference standards of DSS (>99.0% purity) and p-hydroxybenzoic acid (IS, (>99.0% purity) was purchased from the National Institute for Control of Pharmaceutical and Biological Products (Beijing, P.R.China). Acetonitrile, methanol and formic acid (HPLC grade) were purchased from Dikma (Richmond Hill, NY, USA). Water was purified using a Milli-Q system (Millipore Corporation, Billerica, MA).
Animals
Male Sprague Dawley rats (210-240 g) were obtained from Sino-British Sippr/BK Lab Animal Ltd (Shang-hai, P.R.China). The protocol of the study was reviewed and approved by the Ethical Committee of the Faculty of Medicine, Nanchang Tasly Group Co. Ltd, China.
Instrumentation
A triple quadrupole tandem mass spectrometer (Micromass Quattro Premier XE mass spectrometer, Waters Corp., Milford, MA, USA) with an electrospray ionization (ESI) interface was employed for analysis. An UPLC BEH C18 column (50 mm×2.1 mm, 1.7 um, waters Corp., Milford, MA, USA) was used to separate the analytes. All data were collected in centroid mode and processed using MassLynxTM NT 4.0 software with a QuanLynxTM program (Waters Corp., Milford, MA, USA).
HPLC/MS/MS Conditions
A gradient elution program was conducted for chromatographic separation with the mobile phase A (acetonitrile), and the mobile phase B (water containing 0.5% formic acid) as follows: 0 min (5%, A), 2.5 min (30%, A), 4.0 min ( 90%, A), 6.0 min (90%, A) and 7.0 min (90%, A) and finished at 7 min. The flow rate was 0.15 mL/min and column temperature was 40 °C. Injection wash solvents were methanol–water–0.1% formic acid (5:95:0.1, v/v/v) and methanol–water–0.1% formic acid (95:5:0.1, v/v/v) for weak and strong wash, respectively. For MS detection, negative ESI was used as the ionization mode. Nitrogen was used as the desolvation and cone gas with a flow rate of 600 and 50 L/h, respectively. High purity argon was used as the collision gas at a pressure of approximately 3.05×10⁻³ mbar. The optimal MS parameters were as follows: capillary 2.5 kV, source temperature 120 °C, and desolvation temperature 380 °C. Cone voltage was 22 V for both DSS and p-hydroxybenzcic acid. Quantification was performed using multiple reaction monitoring (MRM) of the transitions of m/z197→135 with collision energy (CE) of 16 eV for DSS and m/z 137→93 with CE of 20 eV for p-hydroxybenzcic acid.
Preparation of Calibration Standards and Quality Control Samples
Standard stock solution of DSS was prepared in water at the concentration of 0.4 mg/mL. The working solution of internal standard (1.0 μg/mL) was also prepared in water. A series of standard solutions of 100, 200, 500, 800, 1000, 2000 ng/mL for DSS was prepared by serially diluting the stock solution. All the solutions were stored at 4 °C. DSS calibration curves were prepared by spiking 100 mL of blank rat plasma with 50 μL of DSS standard solution, 50 μL of internal standard solution. The corresponding nominal plasma concentrations for DSS were 50, 100, 250, 400, 500, 1000 ng/mL The quality control (QCs) samples at low, medium, high concentration levels were prepared in the same way as the DSS calibration curves. The nominal plasma concentrations of QC samples were 100, 500, 900 ng/mL.
Sample Preparation
To 100-μL aliquot of plasma sample, 50-μL of internal standard solution (1 μg/mL), 50 μL of water, 10 μL of hydrochloric acid solution (1 M) and 300-μL of methanol were added. The mixture was briefly mixed and then centrifuged at 10000×g and 4 °C for 5min. The supernatant was transferred and evaporated under N2 at 37 °C. The remaining was reconstituted in 200-μL of water by vortex mixing (1 min). The resulting solution was transferred to an autosampler vial at 4 °C, and injected (5 μL) into HPLC/MS/MS system.
Method Validation
Selectivity was assessed by comparing chromatograms of six different batches of blank rat plasma with the corresponding spiked rat plasma. Linearity was assessed by weighted (1/x2) least squares analysis of six different calibration curves. Intra- and inter-day precision (the relative standard deviation, RSD) and accuracy (the relative error, RE) were determined by analysis of low, medium, and high QC samples (n = 6) on 3 different days. The matrix effect was investigated by comparing the peak areas of analytes in the post-extraction spiked blank plasma at low and high concentrations with those of the corresponding standard solutions. The extraction recovery was determined by comparing the mean peak areas of six extracted samples at low, medium, and high QC concentrations with the mean peak areas of spike-after-extraction samples. The stability of low and high QC samples (n = 3) in three complete freeze/thawcycles (−80 to 22 °C), long-termsample storage (−80 °C for 30 days), and bench-top (23 °C for 2 h) was assessed. The ready to-injection stability of extracted samples in the autosampler rack at 4 °C for 24 h was also evaluated.
Pharmacokinetic (PK) Study in Rats
Male Sprague–Dawley rats weighing from 210 to 240 g were used for PK study. All animal experiments were performed in accordance with institutional guidelines and were approved by the Committee on Use and Care of Animals, Jiangxi University of Traditional Chinese medicines. The aqueous solutions of guanxinsu were administrated to a rat by gavage at 2.41 g/kg (calculated as DSS). Serial blood samples (0.2 mL) were obtained at 0, 5, 20, 30, 45 min and 1, 2, 4, 8, 10, 12, 24 h after oral administration separately. During sampling, rats were anesthetized with ether. All samples were placed into heparinized tubes. After centrifugation at 4000×g and 4 °C for 10 min, plasma was collected and frozen at −80 °C until analysis.
The plasma concentration time profiles obtained from the experimental animals were analyzed by non-compartmental analysis. The maximum plasma concentration (Cmax) and the time-to-maximum concentration (Tmax) were obtained directly from raw data. The area under curve (AUC0-t) was calculated using the linear-trapezoidal rule, and the apparent elimination half-life (tl/2) was calculated from the relationship t1/2 =ln2/Ke, where Ke, represents the terminal elimination rate constant and was calculated by linear regression of the final log-linear part of the drug concentration time curve.
Results and Discussion
Mass Spectrometry
DSS had a carboxyl group in the molecular structure. It has a stronger mass response under the negative ionization mode than the positive mode. It was the same case for the hydrophilic compound p-hydroxybenzoic acid. In addition, ESI source provided a better response than APCI source for the two analytes. The product spectrum of the M- of DSS was dependent on the collision energy. The major fragment ion m/z 135 was formed at higher collision energy (16 eV) (Figure 1), and the most abundant ion m/z 179 was formed at lower collision energy (11 eV). The transition of m/z 197→135 gave a higher signal-to-noise (S/N) ratio and better response than that of m/z 197→179 during the analysis of the spiked plasma samples. As a result, the transition of m/z 197→135 was selected for MRM analysis. In the same way, the transition of m/z 137→93 for p-hydroxybenzoic acid was selected for MRM analysis.
Figure 1.The mass spectra of M- ions of DSS (A) and p-hydroxybenzoic acid (B).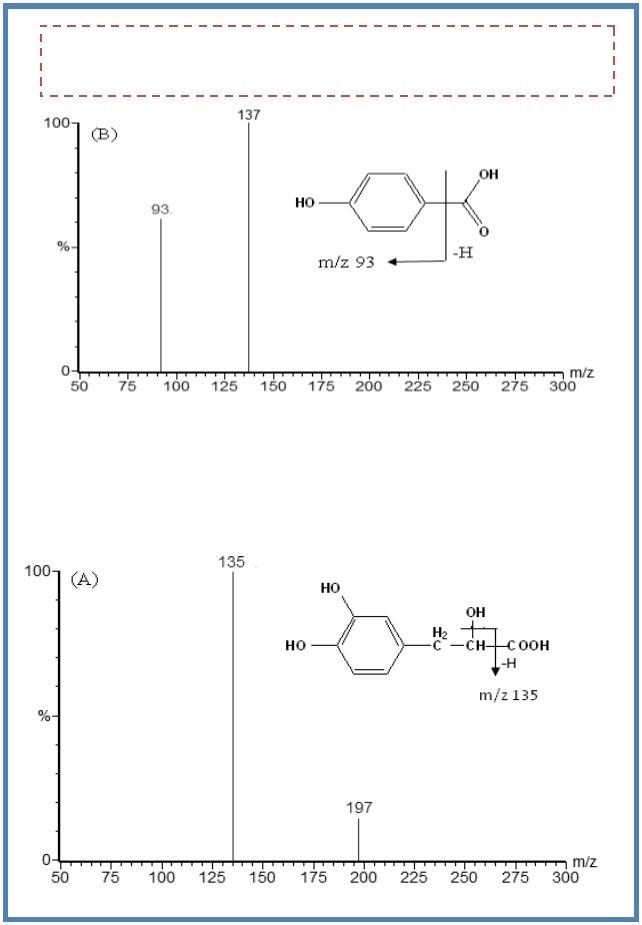
Sample Preparation
Various approaches were adopted to prepare the plasma samples using protein precipitation, liquid-liquid extraction (LLE), or solid phase extraction (SPE). Protein precipitants such as methanol and acetonitrile was used. It was found by comparison that the recovery and relative standard deviation of protein precipitation and LLE were better than those of SPE.7During our exploration, we found this method provided a very low recovery (about 50%). The protein precipitation method using methanol can provide a relatively high recovery (about 80%). Furthermore, this method was simple and fast when compared with the liquid-liquid extraction method.
Specificity and Matrix Effects
Fig shows the typical chromatograms of a blank, a spiked plasma sample with DDS (50 ng/mL) and the internal standard (1.0 μg/mL), a plasma sample from a rat after an oral administration of guanxinsu solution. No interference from the endogenous compound with the analytes and the internal standard was detected.
The matrix effects calculated were in the range of −7.1% to 4.5%, which was within the acceptable limits. Calibration curves were obtained between the mass responses and the plasma concentration over the range of 50–1,000 ng/mL for DDS. All correlation coefficients (r) exceeded 0.99, showing a good linearity over the concentration range. The lower limit of quantitation (LLOQ) was 50 ng/mL for DSS in rat plasma. The intra- and inter-RSD were both less than 8.9% and the RE were within 9.6% for the analytes at LLOQ level, which were within the acceptable limits. The intra- and inter-day precision and accuracy for DSS at three QC concentration levels were shown in Table 1. The results indicated that all the values were within the acceptable range of ±15% and the method is accurate and precise. The mean extraction recovery was 83.1±3.4%, 85.7±2.8%, and 76.1±4.5% for DSS at 100, 500, and 900 ng/mL, respectively. The mean recovery of the internal standard was 88.4±4.8%. All recoveries had RSD less than 5% at three different concentrations, showing good assay consistency.
Stability results in Table 2 demonstrated that DSS was stable in rat plasma under the indicated conditions.
Figure 2.MRM chromatograms of DDS (I) and p-hydroxybenzcic acid (IS, II) in rat plasmas: (A) a blank rat plasma sample; (B) a blank rat plasma sample spiked with DSS (50 ng/mL) and p-hydroxybenzcic acid (1.0 μg/mL); (C) a plasma sample 1 h after the administration of a single oral dose of guanxinsu solution at 2.41 mg/kg (calculated as DSS) to a Sprague–Dawley rat.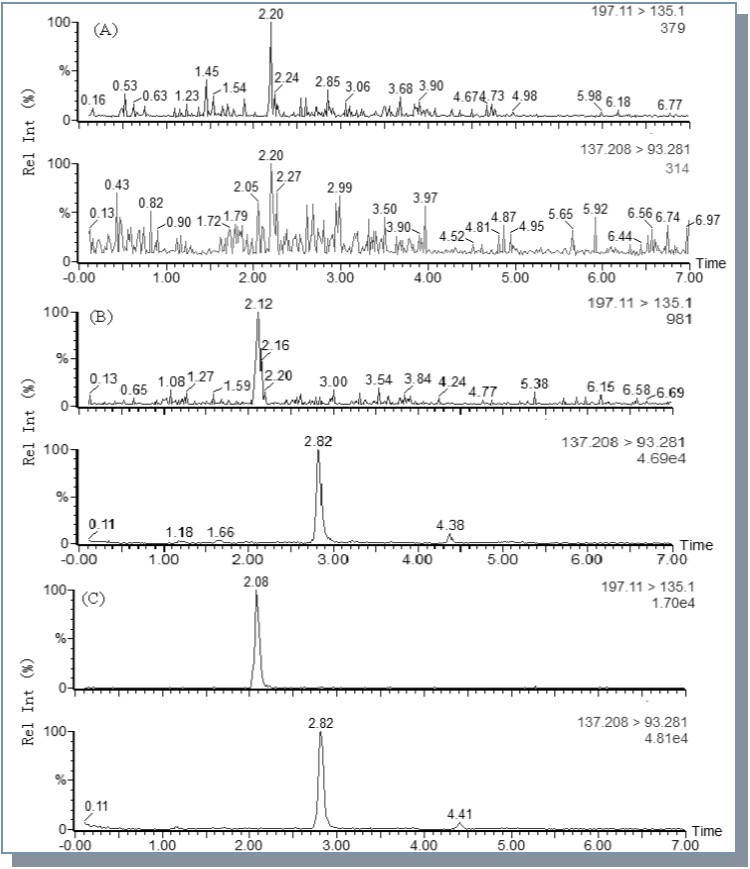
| Concentration (ng/ml) | RSD (%) | Relative error (%) | ||
|---|---|---|---|---|
| Added | Found (mean) | Intra-day | Inter-day | |
| 100 | 105.2 | 4.5 | 5.3 | 5.2 |
| 500 | 539 | 5.9 | 3.8 | 7.8 |
| 900 | 944 | 6.0 | 4.2 | 4.9 |
| Storage conditions | Concentration (ng/ml) | |||
|---|---|---|---|---|
| Added | Found | RSD(%) | RE(%) | |
| Bench-top 2 h | 100 | 97 | 4.3 | -3 |
| 900 | 867.5 | 5.2 | -3.6 | |
| Three freeze/thaw cycles | 100 | 108.3 | 3.8 | 8.3 |
| 900 | 965 | 5.7 | 7.2 | |
| Auto sampler rack for 24 h °C | 100 | 94.5 | 6.2 | -5.5 |
| 900 | 943 | 4.9 | 4.8 | |
| Freezing for 30 °C at -80 °C | 100 | 105.5 | 8.1 | 5.5 |
| 900 | 954 | 3.2 | 6.0 | |
Application of the Method to a Pharmacokinetic Study in Rats
This validated method was successfully applied to PK studies of DSS following oral administration of guanxinsu solution to a Sprague–Dawley rat at 2.41 mg/kg (calculated as DSS), respectively. The typical plasma concentration–time profile of DSS is shown in Figure 3.
The maximum plasma concentration (Cmax) amounted to 442.12±43.65 ng/mL; the time to maximum plasma concentration (Tmax) was 0.85±0.15 h; and the half-life (t1/2) was 0.30±0.17h, while the area under the curve (AUC0-t) was 3334.19±76.84 ng.h/mL. The mean elimination rate constant(Ke)was 2.31 h-1. This shows that DDS mainly elimination in the body, belong to slow elimination process.
Figure 3.Mean plasma concentration–time profiles for DSS after the administration of a single oral dose of 2.41 g/kg guanxinsu solution to 10 rats.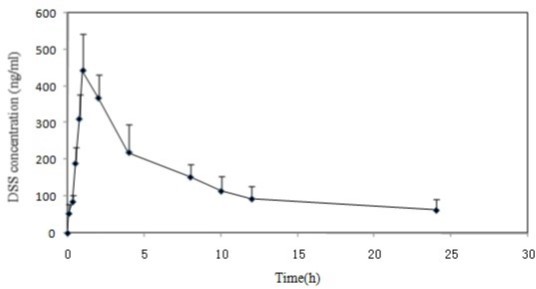
Conclusions
A sensitive, specific and rapid HPLC–MS/MS method was developed for the analysis of DSS in rat plasma. It is very convenient for the analysis of large numbers of samples containing DDS due to simple plasma pretreatment and short analysis time. The present method has been successfully applied to the PK study of DSS in the rat.
Fund Project:
The national natural science fund projects(81060339)
Acknowledgements
This work was supported by the international science and technology cooperation program (2006DFB33080).
References
- 2.Wu B, Liu M, Liu H, Li W, Tan S et al. (2007) Meta-analysis of traditional Chinese patent medicine for ischemic. , Stroke 38, 1973-9.
- 3.Han J Y, Fan J Y, Horie Y, Miura S, Cui D H et al. (2008) Ameliorating effects of compounds derived from Salvia miltiorrhiza root extract on microcirculatory disturbance and target organ injury by ischemia and reperfusion. , Pharmacol Ther 117, 280-95.
- 4.Lu T, Yang J L, Gao X M, Chen P, Du F F et al. (2008) Plasma and Urinary Tanshinol from Salvia miltiorrhiza (Danshen) Can Be Used as Pharmacokinetic Markers for Cardiotonic Pills, a Cardiovascular Herbal Medicine. Drug Metab Dispo. 36(8), 1578-86.
- 5.Satoshi M, Yuri G, Yukihiro S. (1994) Production of Lithospermic Acid B and Rosmarinic Acid in Callus Tissue and Regenerated Plantlets of Salvia miltiorrhiza. , J. Nat. Products 57(6), 817-23.
Cited by (3)
This article has been cited by 3 scholarly works according to:
Citing Articles:
Chemistry of Natural Compounds (2025) Crossref
Mariana de Arruda Silva, Leticia Pereira Feijo da Silva, Arielly Celestino Rodrigues dos Santos, Ana Carolina Magalhaes Rocha, Edna Maria dos Anjos Almudi et al. - Chemistry of Natural Compounds (2025) Semantic Scholar
S. Pedro, Tiago A. Fernandes, Â. Luís, Alexandra M. M. Antunes, J. C. Gonçalves et al. - Plants (2023) Semantic Scholar
Bioorganic Chemistry (2023) Crossref
M. Marzouk, Shimaa M Khalifa, Amal H. Ahmed, A. Metwaly, Hala Sh. Mohammed et al. - Bioorganic chemistry (Print) (2023) Semantic Scholar