
Scrutinizing Famine Disaster Based On Rainfall Trend Investigation (A Case Study of Khorasan Razavi Province)
Abstract
Rainfall is one of the most important components of the hydrological cycle. The importance of rainfall in arid and semi-arid regions is more apparent. Due to the important role of rainfall trend assessment in the proper management of water resources, in the present study, Khorasan Razavi province, the second-most populous province of Iran located in the northeast of the country, for this purpose was studied. Currently, this region is facing water shortage problems. In this study, the non-parametric Mann-Kendall method was used to evaluate the annual rainfall trend over a thirty-year period from 1989 to 2019. On the other hand, Sen's slope estimator method was used to determine the magnitude of the rainfall trend in the studied synoptic and rain gauge stations. The results showed that the root of water shortage problems is not due to drastic changes in rainfall. Therefore, water shortage problems in Khorasan Razavi province are mainly due to a lack of proper management (i.e., mismanagement). The present study, by examining the rainfall trend using an appropriate framework, tried to take an effective step towards improving the management of water resources in the northeast of Iran.
Author Contributions
Copyright © 2022 Omid Zabihi, et al.
 This is an open-access article distributed under the terms of the Creative Commons Attribution License, which permits unrestricted use, distribution, and reproduction in any medium, provided the original author and source are credited.
Competing interests
The authors have declared that no competing interests exist.
Citation:
Introduction
Climate change has a direct impact on water resources and consequently on society and the economy 1, 2. It has a diverse effect on the environment and may impact temperature, rainfall, and ecosystem functions 3, 4, 5. Rainfall is the main climate factor that rules the hydrologic cycles and determining its change is essential in water resources management 2, 6, 7. It becomes more important in arid and semi-arid regions where water scarcity is a common issue and regional agriculture is being affected by long-term precipitation changes 8, 9. Therefore, analyzing rainfall trends become important in such regions to better manage water scarcity or reservoir overflow and their derivative problems 10.
It’s crucial to determine precipitation trend change in each region to develop and improve regional strategies for water resources management 6, 11. Rainfall trend analysis has received much attention and has been investigated by many researchers all over the world in the past century 12. Its trend has been investigated in global 13, 14, 15, 16 and regional scales 17, 18, 9, 19 by parametric 20, 21, 22 and non-parametric tests 23, 24, 25, 26, 27. Non-parametric tests have been used more frequently than parametric tests since they are distribution-free 28, therefore in this study the non-parametric Mann-Kendall test, which is the most frequently used non-parametric test in this regard 29, has been used to determine annual rainfall trend in Khorasan Razavi province of Iran.
Several studies have been investigated or mentioned the climate change impacts on Khorasan Razavi province since it is the second populated province in Iran. The climate change effect on crops yield 30, maize production and growth stages 31, 32, 33, assessment and adaption strategies for wheat and saffron yield 31, 34, 35, buildings energy demand 36, temperature trend 37 and vegetation cover trend 38 has been investigated. Recently, this province has encountered water shortage problems and most cities have encountered water supply problems that may be due to climate change effect and miss management. So, climate change effect on the province precipitation can be assumed as a research gap that will be investigated and analyzed in this study. The present study aims to (i) Analyze the long-term rainfall data; (ii) Determine the rainfall trend; and, (iii) Determine the median rate of change in rainfall trend in Khorasan Razavi province.
Materials and Methods
Case Study
Khorasan Razavi province with about six million populations is the second populated province in Iran which 75% of its area is arid and the rest is semi-arid 39, 40. It is also the 5th largest province and has common boundaries with Turkmenistan and Afghanistan which is shown in Figure 1 with studied synoptic and rain gauge stations. The province has lots of historical monuments like the 8th imam of Shias shrine located in the province center i.e. Mashhad city which is being visited by about 20 million people each year equal to 25% of the country’s population 41. The province has the most declination of groundwater sources among the countries provinces which is 1028 million cubic meters (MCM) and by 184 MCM during 2019 40 that shows the province is in a critical situation about water resources management.
Figure 1.The location of Khorasan Razavi province and related stations of the study area.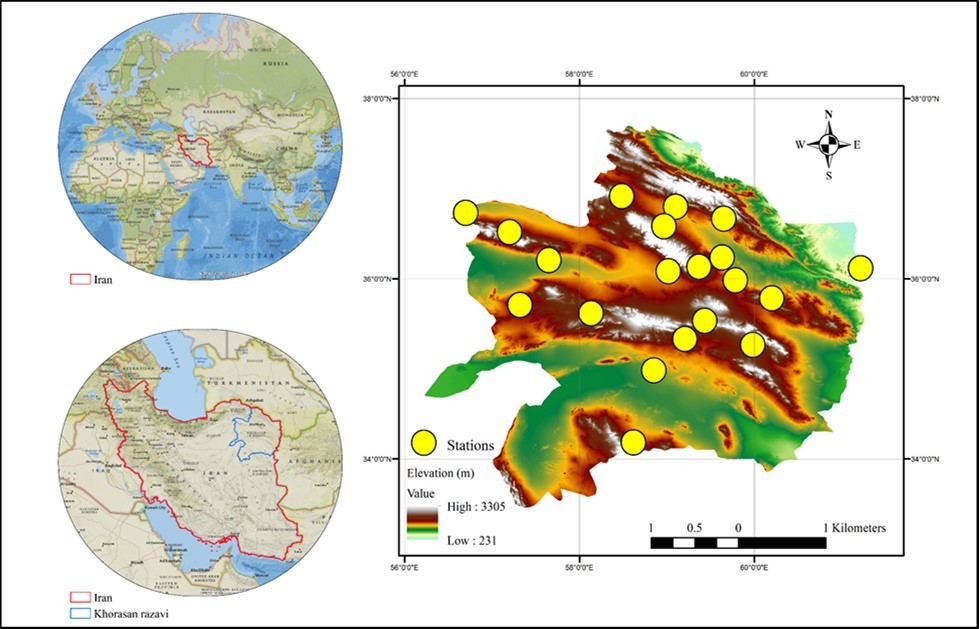
The Research Road Map
For analyzing the rainfall trend in Khorasan Razavi province, the rainfall data were gathered from the Iran meteorological organization for 30 years from 1989 to 2019 for 20 synoptic and rain gauge stations. The homogeneity of the annual data time series has been investigated and the non-parametric Mann-Kendall 42, 43 test was used to determine the annual trend in time series, after that the Sen’s slope estimator 44 was used to detect the median change in stations trend. The research steps are reported in Figure 2.
Figure 2.Research road map or frame work.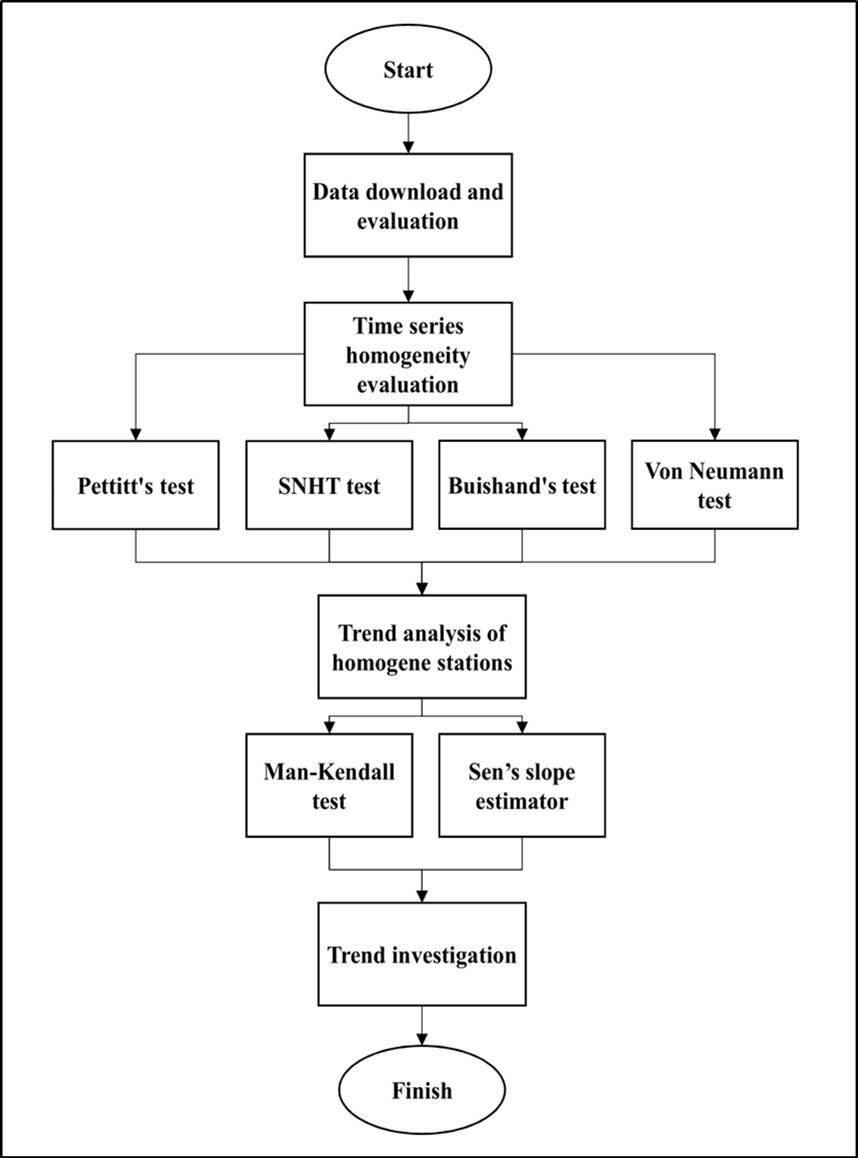
Homogeneity and Trend Analyses
The homogeneity of data time series has been investigated by using Pettitt's test 45, SNHT test 46, Buishand's test 47, and von Neumann test 48 in excel using XLSTAT 2019. The homogeneity has been studied at a 95% confidence interval on the p-value. The stations were determined homogeneous if they were considered homogenous at 0.05 significance level by at least two tests. The trend of datasets has been studied using non-parametric Mann-Kendall test 42, 43 at 0.05 significance level, that is calculated as follows,
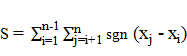 (1)
(1)
where n is the number of data points, xiand xj are the data values in the time series i and j (j > i), respectively, and sgn (xj - xi) is the sign function that is defined by,
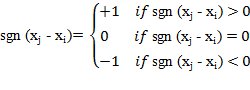 (2)
(2)
As well as, the median change of trends has been determined using Sen’s slope estimator 44, as follows,
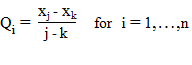 (3)
(3)
where xj and xk are the data values at times j and k (j > k), respectively, and n is the number of time periods.
Results and Discussion
The homogeneity tests revealed that four stations were considered non-homogeneous by only one test and three stations were considered non-homogeneous by two tests. Therefore, all stations were considered homogeneous by at least two tests and so determined homogeneous; Thus, all 20 stations are involved in the trend study to detect the rainfall trend of each station. The total stations that are considered homogeneous by each homogeneity test are reported in Table 1.
Table 1. The total homogeneous stations are considered by each test.| Pettitt's test | SNHT test | Buishand's test | Von Neumann test | |
| Homogeneous stations | 19 | 16 | 17 | 18 |
The long-term average rainfall of Khorasan Razavi province for the thirty-year period is 242 mm and each year rainfall to the long-term average depicted in Figure 3. It indicates the annual precipitation for 16 years was more than the long-term average which shows that by true management, the excess water in rainy years can be saved to use in drought times. Moreover, it shows that the water shortage problems are due to mismanagement since the long-term average doesn’t show a significant trend. It should be noted that the problem of mismanagement is not limited to Khorasan Razavi province and in most parts of the country, we see this problem in the field of water. Another reason for the water shortage problem that has led to the water crisis in the study region is the excessive and uncontrolled withdrawal of groundwater resources. Rainfall penetrates the aquifers of the study area and recharges the groundwater resources, but over-exploitation from this source, usually with unauthorized/unlicensed wells, causes a decrease in the aquifer levels. Rapid population growth in the study area and migration from small towns to Khorasan Razavi province, which is the second-most populous province in Iran, are other causes of water shortage in the study region. Therefore, it is observed that the survey of rainfall trends can clarify many probable issues/problems in the field of water resources management.
Figure 3.The total average annual rainfall to total long-term rainfall in the study area.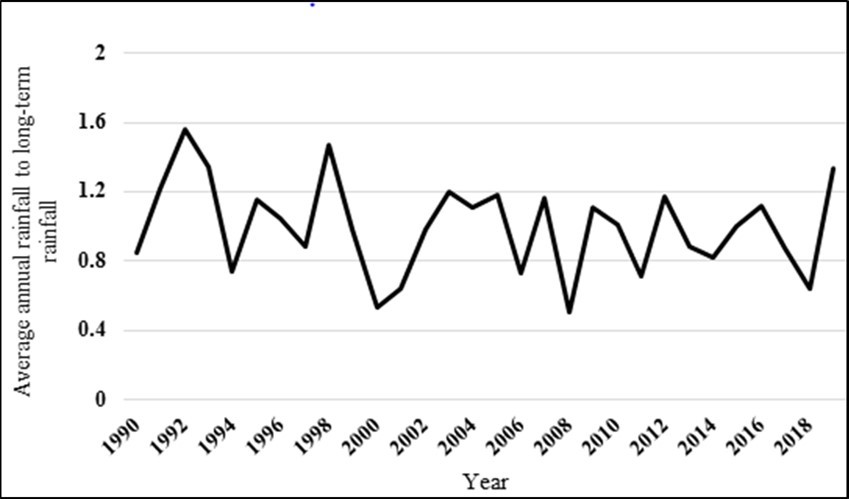
The maximum and minimum rainfall in the stations are reported in Table 2 within the mean and standard deviations. The analysis revealed that the maximum and minimum annual rainfall belongs to Moghan station in 1992 by 646 mm and Azadvar station in 1990 by 28 mm. The rainiest station is Moghan in the center of the province by the annual long-term average of 398 mm, and the Mahane station has the least long-term annual average precipitation of 158 mm in the south of the study province.
The station's data time series trend has been found out by using the nonparametric Mann-Kendall test. Only two stations had a significant trend at 95% confidence which is shown in Figure 4. The Sen’s slope estimator was used to determine the median change of trend at these stations and was -2.86 for Mahane and -3.18 for Torbat-e heydariyeh station
Table 2. The station's elevation from the sea surface (m), as well as minimum, maximum, mean, and standard deviation of long-term annual rainfall.| Station | Station elevation (m) | Minimum (mm) | Maximum (mm) | Mean (mm) | Standard deviation |
| Radekan | 1180 | 101.900 | 309.166 | 217.318 | 58.500 |
| Azadvar | 984 | 28.000 | 314.382 | 170.913 | 71.910 |
| Kardeh | 990 | 148.806 | 440.579 | 258.438 | 71.450 |
| Akhlemade olia | 1350 | 110.240 | 450.300 | 243.772 | 90.917 |
| Moghan (gharemoghan) | 1900 | 217.600 | 646.800 | 398.600 | 113.735 |
| Khayyam | 1230 | 119.210 | 470.100 | 287.910 | 95.765 |
| Sangbast | 1500 | 106.040 | 431.310 | 220.305 | 81.019 |
| Shahane-garmab | 1500 | 118.300 | 454.400 | 251.926 | 82.705 |
| Mahaneh | 950 | 56.500 | 297.800 | 158.507 | 58.675 |
| Shahine-olya | 1620 | 108.877 | 479.100 | 246.909 | 93.450 |
| Shirtappeh | 275 | 80.300 | 361.000 | 224.046 | 66.730 |
| Homayi | 1337 | 88.071 | 308.400 | 191.868 | 63.991 |
| Kakhk | 1545 | 71.500 | 335.500 | 197.482 | 81.126 |
| Barsalan | 1660 | 153.655 | 633.900 | 375.770 | 117.026 |
| Nasarrokh | 2130 | 95.600 | 563.300 | 287.892 | 115.573 |
| Zarghan | 1370 | 127.500 | 532.500 | 268.666 | 93.420 |
| Kharsaf | 1565 | 81.177 | 432.747 | 184.529 | 69.825 |
| Sabzevar | 962 | 84.890 | 297.323 | 179.984 | 60.470 |
| Mashhad | 999 | 106.040 | 422.320 | 238.339 | 79.393 |
| Torbat-e heydariyeh | 1451 | 99.230 | 455.190 | 245.591 | 87.844 |
| Total average in Khorasan Razavi | 1324.9 | 123.833 | 378.023 | 242.438 | 64.278 |
Figure 4.The average annual rainfall (mm) and the rainfall trend in the study area.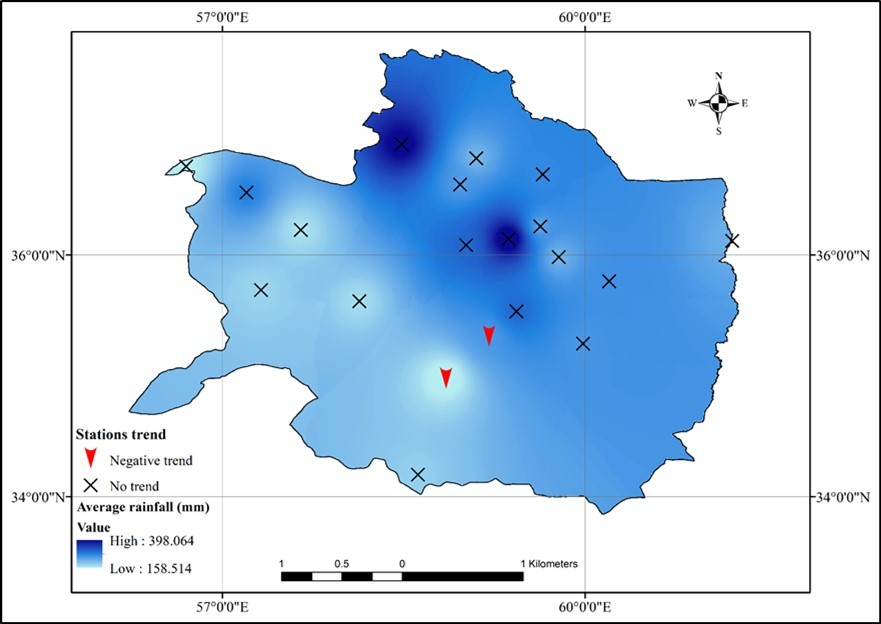
Conclusion
Rainfall is a key component in the hydrological process, especially in arid/semi-arid regions such as Iran. Given that the study of rainfall is of particular importance in the management of water resources, such a study seemed necessary in Khorasan Razavi province, the second-most populous region in Iran located in the northeast of the country. Investigating the trend of average rainfall over a period of thirty years (1989-2019), it was observed that the trend of average rainfall has not changed much. However, in this region, we are witnessing many problems, including water shortages, one of the main reasons for which is the lack of proper management (i.e., mismanagement) of water resources. Also, a more detailed study of the synoptic and rain gauge stations in the study area from the perspective of rainfall trend showed that except for two stations that had a decreasing rainfall trend, no special trend was observed in other stations. As a result, the general framework used in the present study, including evaluating the homogeneity of time series data and then using the Mann-Kendall and Sen's slope estimator methods together, is a good option for the purposes of evaluating rainfall trends.
Disclosure Statement
No potential conflict of interest was reported by the authors.
References
- 1.Caloiero T. (2015) Analysis of rainfall trend in New Zealand. , Environmental Earth Sciences 73(10), 6297-6310.
- 2.Nisansala W D S, N S Abeysingha, Islam A, Bandara A M K R. (2020) Recent rainfall trend over Sri Lanka (1987–2017). , International Journal of Climatology 40(7), 3417-3435.
- 3.C S Hendrix, Salehyan I. (2012) Climate change, rainfall, and social conflict in Africa. , Journal of peace research 49(1), 35-50.
- 4.Heutel G, N H Miller, Molitor D. (2021) Adaptation and the mortality effects of temperature across US climate regions. , Review of Economics and Statistics 103(4), 740-753.
- 5.A P Pires, D S Srivastava, N A Marino, MacDonald A A M, M P Figueiredo‐Barros et al. (2018) Interactive effects of climate change and biodiversity loss on ecosystem functioning. , Ecology 99(5), 1203-1213.
- 6.Barua S, Muttil N, Ng A W M, Perera B J C. (2013) Rainfall trend and its implications for water resource management within the Yarra River catchment. , Australia. Hydrological Processes 27(12), 1727-1738.
- 7.Shirisha P, Reddy Venkata, K, Pratap D. (2021) Application of adaptive grey method for rainfall forecasting in a watershed. , ISH Journal of Hydraulic Engineering 27(3), 267-273.
- 8.Asfaw A, Simane B, Hassen A, Bantider A. (2018) Variability and time series trend analysis of rainfall and temperature in northcentral Ethiopia: A case study in Woleka sub-basin. Weather and climate extremes. 19, 29-41.
- 9.Kumar V, S K Jain, Singh Y. (2010) Analysis of long-term rainfall trends. in India. Hydrological Sciences Journal–Journal des Sciences Hydrologiques 55(4), 484-496.
- 10.Cannarozzo M, L V Noto, Viola F. (2006) Spatial distribution of rainfall trends. in Sicily (1921–2000). Physics and Chemistry of the Earth, Parts A/B/C 31(18), 1201-1211.
- 11.Mannan A, Chaudhary S, C T Dhanya, A K Swamy. (2018) Regionalization of rainfall characteristics in India incorporating climatic variables and using self-organizing maps. , ISH Journal of Hydraulic Engineering 24(2), 147-156.
- 12.Caloiero T, Coscarelli R, Ferrari E. (2020) Assessment of seasonal and annual rainfall trend in Calabria (southern Italy) with the ITA method. , Journal of Hydroinformatics 22(4), 738-748.
- 13.R S Bradley, H F Diaz, J K Eischeid, P D Jones, P M Kelly et al. (1987) Precipitation fluctuations over Northern Hemisphere land areas since the mid-19th century. , Science 237(4811), 171-175.
- 14.H F Diaz, R S Bradley, J K Eischeid. (1989) Precipitation fluctuations over global land areas since the late 1800's. , Journal of Geophysical Research: Atmospheres 94(1), 1195-1210.
- 15.Hulme M, T J Osborn, T C Johns. (1998) Precipitation sensitivity to global warming: Comparison of observations with HadCM2 simulations. , Geophysical research letters 25(17), 3379-3382.
- 16.New M, Todd M, Hulme M, Jones P. (2001) Precipitation measurements and trends in the twentieth century. , International Journal of Climatology: A Journal of the Royal Meteorological Society 21(15), 1889-1922.
- 17.Biasutti M. (2019) Rainfall trends in the African Sahel: Characteristics, processes, and causes. , Wiley Interdisciplinary Reviews: Climate Change 10(4), 591.
- 18.Gedefaw M, Yan D, Wang H, Qin T, Girma A et al. (2018) Innovative trend analysis of annual and seasonal rainfall variability in Amhara regional state. , Ethiopia. Atmosphere 9(9), 326.
- 19.Modarres R, Sarhadi A. (2009) Rainfall trends analysis of Iran in the last half of the twentieth century. , Journal of Geophysical Research: Atmospheres 114(3).
- 20.Caloiero T, Coscarelli R, Ferrari E, Mancini M. (2011) Trend detection of annual and seasonal rainfall in Calabria (Southern Italy). , International Journal of Climatology 31(1), 44-56.
- 21.Malik A, Kumar A. (2020) Spatio-temporal trend analysis of rainfall using parametric and non-parametric tests: case study. in Uttarakhand, India. Theoretical and Applied Climatology 140(1), 183-207.
- 22.Pal I, Al-Tabbaa A. (2011) Assessing seasonal precipitation trends in India using parametric and non-parametric statistical techniques. , Theoretical and Applied Climatology 103(1), 1-11.
- 23.S H Bari, Rahman M T U, M A Hoque, M. (2016) Analysis of seasonal and annual rainfall trends in the northern region of Bangladesh. , Atmospheric Research 176, 148-158.
- 24.Kumar N, Tischbein B, M K Beg. (2019) Multiple trend analysis of rainfall and temperature for a monsoon-dominated catchment in India. Meteorology and Atmospheric Physics. 131(4), 1019-1033.
- 25.P G Oguntunde, B J Abiodun, Lischeid G. (2011) Precipitation trends in. , Nigeria, J. Hydrol 411, 207-218.
- 26.S D Río, Herrero L, Fraile R, Penas A. (2011) Spatial distribution of recent rainfall trends in Spain (1961–2006). , International Journal of Climatology 31(5), 656-667.
- 27.D K Prajapat, Choudhary M. (2021) Spatial distribution of precipitation extremes over Rajasthan using CORDEX data. , ISH Journal of Hydraulic Engineering 27(3), 289-300.
- 28.Jagadeesh P, Anupama C. (2014) Statistical and trend analyses of rainfall: a case study of Bharathapuzha river basin. , Kerala, India, ISH Journal of Hydraulic Engineering 20(2), 119-132.
- 29.P M Baria, S M Yadav. (2021) Investigating extreme rainfall non-stationarity of upper Tapi river basin. , India, ISH Journal of Hydraulic Engineering 27(1), 521-529.
- 30.Karimi V, Karami E, Keshavarz M. (2018) Climate change and agriculture: Impacts and adaptive responses in Iran. , Journal of Integrative Agriculture 17(1), 1-15.
- 31.Farhangfar S, Bannayan M, H R Khazaei, Baygi M M. (2015) Vulnerability assessment of wheat and maize production affected by drought and climate change. , International Journal of Disaster Risk Reduction 13, 37-51.
- 32.Moradi R, Koocheki A, Mahallati Nassiri, M. (2014) Adaptation of maize to climate change impacts in Iran. Mitigation and adaptation strategies for global change. 19(8), 1223-1238.
- 33.Moradi R, Koocheki A, Mahallati Nassiri, M, Mansoori H. (2013) Adaptation strategies for maize cultivation under climate change in Iran: irrigation and planting date management. , Mitig. Adapt
- 34.Kouzegaran S, Baygi Mousavi, Babaeian M, I, Khashei-Siuki A. (2020) Future projection of the effects of climate change on saffron yield and spatial-temporal distribution of cultivation by incorporating the effect of extreme climate indices. , Theoretical and Applied Climatology 141(3), 1109-1118.
- 35.Paymard P, Bannayan M, R S Haghighi. (2018) Analysis of the climate change effect on wheat production systems and investigate the potential of management strategies. , Natural Hazards 91(3), 1237-1255.
- 36.G R Roshan, J A Orosa, Nasrabadi T. (2012) Simulation of climate change impact on energy consumption in buildings, case study of Iran. , Energy Policy 49, 731-739.
- 37.Rahimi J, Malekian A, Khalili A. (2019) Climate change impacts in Iran: assessing our current knowledge. , Theoretical and Applied Climatology 135(1), 545-564.
- 38.Emamian A, Rashki A, D G Kaskaoutis, Gholami A, Opp C et al. (2021) Assessing vegetation restoration potential under different land uses and climatic classes in northeast Iran. , Ecological Indicators 122, 107325.
- 39.S H Hosseini, M R Khaleghi, Jami H, Baygi S. (2018) Comparison of hybrid regression and multivariate regression in the regional flood frequency analysis: A case study in Khorasan Razavi province. , Environmental Health Engineering and Management Journal 5(2), 93-100.
- 40.Regional Water Company of Khorasan Razavi (2021) Water picture of Khorasan Razavi province [In Persian]. , Khorasan Razavi, Iran
- 41.Esmaili R. (2018) Determination of air pollution’s homogenous areas in Mashhad. , Journal of Natural Environmental Hazards 7(16), 227-240.
- 43.H B Mann. (1945) Nonparametric tests against trend. , Econometrica: Journal of the econometric society 245-259.
- 44.P K Sen. (1968) Estimates of the regression coefficient based on Kendall's tau. , Journal of the American statistical association 63(324), 1379-1389.
- 45.A N Pettitt. (1979) A non‐parametric approach to the change‐point problem. , Journal of the Royal Statistical Society: Series C (Applied Statistics) 28(2), 126-135.
- 46.Alexandersson H. (1986) A homogeneity test applied to precipitation data. , Journal of climatology 6(6), 661-675.
Cited by (1)
- 1.Sarvestan Rasoul, Barati Reza, Shamsipour Aliakbar, Khazaei Sahar, Kleidorfer Manfred, 2024, Evaluation of the performance of satellite products and microphysical schemes with the aim of forecasting early flood warnings in arid and semi-arid regions (a case study of northeastern Iran), Natural Hazards, 120(13), 12401, 10.1007/s11069-024-06689-9