
Role of Tie2, CD14, Angiopoietin as Angiogenetic Markers in Hepatocellular Carcinoma Complicating Hepatitis C Virus Infection
Abstract
Background
Identifying biomarkers for early detection of hepatocellular carcinoma (HCC) remains quite challenging. In this study we aimed to estimate the number of TIE2-expressing monocytes (TEMs) cells, which display pro-tumoral activities and are defined as CD14+, TIE2+, and angiopoietin-2; and its potential use as a possible diagnostic marker in HCC patients complicating HCV induced cirrhosis.
Methods
Current study was conducted on 112 patients. They were divided into two groups: Group I (78 patients) with HCC complicating HCV induced cirrhosis; and group II chronic hepatitis C patients (34 patients). Both groups were compared to (age and sex-matched) healthy persons as group III (38 persons).
Result
The number of the circulating TEMs: CD14+ and TIE2+ monocytes were significantly higher in the peripheral blood of HCC patients than HCV LC patients and healthy controls, sensitivity and specificity for HCC diagnosis were respectively: CD14 (89.7%, 83.3%), TIE 2 (76.9%, 83.3%), and Ang-2 (76.9%, 66.7%). Moreover, analysis of the P-value and the odd’s ratio showed that CD14 has the highest predictive value for HCC.
Conclusion
Our results suggest that TEMs and Ang-2can be used as diagnostic markers for HCC, especially among the high-risk group of patients.
Author Contributions
Academic Editor: Rada M. Grubovic, Head of Department for Stem Cell Collection President of Macedonian Society for Transfusion Medicine, Macedonia.
Checked for plagiarism: Yes
Review by: Single-blind
Copyright © 2019 El-Zahraa M. Meghezel, et al.
 This is an open-access article distributed under the terms of the Creative Commons Attribution License, which permits unrestricted use, distribution, and reproduction in any medium, provided the original author and source are credited.
Competing interests
The authors have declared that no competing interests exist.
Citation:
Introduction
Hepatocellular carcinoma (HCC) has an increasing incidence all over the world, being the second most common worldwide cancer among males and the sixth among females 1, 2. It is also the second most common cause of cancer deaths 3, 4. HCC has a very high mortality rate due to limited treatment options in the vast majority of cases 1. In Egypt, liver cancer accounts for around 11.75% of gastrointestinal malignancies and 1.68% of the total malignancies. Also, HCC constitutes 70.48% of all hepatic malignancies among the Egyptian population 5. The etiology of HCC is multifactorial, with many infectious and noninfectious health problems. These include hepatitis viral infections (hepatitis B virus (HBV) and hepatitis C virus (HCV)), alcoholic liver cirrhosis and non-alcoholic fatty liver disease (NAFLD). However, the pathogenesis of HCC is not yet fully understood 6. The limited current treatment options available, and treatment resistance, especially chemotherapy, remain the major challenges in the management of such cases. The cause of this is usually due to late diagnosis of HCC, and so there is an increasing need for identifying suitable biomarkers for early detection of HCC; aiming to improve the treatment outcomes 7. Macrophages display several pro-tumorigenic functions that have important roles in cancer initiation and progression 8. Tumor-associated macrophages (TAMs) are heterogeneous macrophage cells that can be subdivided into different populations according to either high or low expression of major histocompatibility complex (MHC) class II. TAMs remain poorly understood and might differ according to tumor type and localization 9. Angiogenesis, or the formation of new blood vessels, is an essential process in the progression, extension, and distant metastasis of many tumors. This is a known dependent risk factor of hematological malignancies and was also proven for many solid tumors 10. Angiopoietin regulators act on tyrosine kinase receptors (Tie) either Tie1 or Tie2, under both normal and pathologic conditions. Angiopoietin-1 (Ang-1) is a constitutive agonist for Tie2phosphorylation (p-Tie2) that contributes to vascular remodeling during the development and subsequent maintenance of vascular stability 11. Angiopoietin-2 (Ang-2) competitively inhibits the action of Ang-1 on Tie2 and promotes vascular remodeling by suppression of Tie2 signaling. The over-expression of Ang-2 leads to embryonic lethality which is similar to what is caused by deletion of either Ang-1 or Tie2 12. Tie2 expressed on proangiogenic macrophages are involved in tumor angiogenesis and intravasation of malignant cells and subsequent metastasis 13. The angiopoietin Ang/Tie2 kinase signaling pathway is an important angiogenic signaling axis which subsequently ends with poor outcome and recurrence in cancer patients 14, 15.
CD14 levels are increased in some inflammatory conditions and may reflect disease severity 16. It is also found to correlate with the degree of liver inflammation in non-alcoholic steatohepatitis (NASH) patients 17.
The study aimed to examine the number of TEM in the blood of HCC patients complicating HCV induced liver cirrhosis (TEM); defined as CD14+, TIE2+, and angiopoietin-2 in HCC cases and its value as a possible diagnostic marker in.
Methods
This study was carried out on 112 Patients: Group I (78) newly diagnosed HCC patients on top of HCV induced cirrhosis according to typical characteristics of HCC seen in dynamic contrast enhancement CT, recruited between October 2016 and November 2017; and group II (34) chronic hepatitis C patients, compared to group III (38) healthy controls.
Exclusion Criteria
Known history of autoimmune diseases, chronic inflammatory diseases, history of other malignancies, and patients with chronic liver disease other than chronic HCV.
All patients were subjected to:
History and Clinical Examination
Laboratory Investigations
Complete blood count (CBC); done by the use of cell dyne-3700 Abbott Diagnostics Dallas USA. Immunophenotyping (IPT) on peripheral blood monocytes CD14 fluoroisothiocyanate(FITC) and TIE2 phycoerythrin(PE). Serum Ang-2 was assayed by enzyme-linked immunosorbent assay (ELISA) using commercially available kits (Elabscience systems Houston, Texas USA). Other Lab Investigations: liver function, alpha-fetoprotein, prothrombin time and concentration, and hepatitis markers: HCV antibody and HBV surface antigen.
Determination of TIE2 Expression on CD14+ FITCMonocytes
The steps involved in the cytoplasmic staining of phycoerythrin PE labeled monoclonal antibodies (MoAb) for detection of both TIE2 and Moab were performed in a biotechnology company (Becton Dickinson Bioscience in San Jose, California). Peripheral blood mononuclear cells (PBMC) were isolated from whole blood by Ficolldensity centrifugation and were then stained with10 microliters of CD14 fluoroiso-thiocyanate (FITC) and incubated for 15 minutes at room temperature in the dark. This was then followed by incubation, red blood cell (RBC) lysis, washing with phosphate-buffered saline (PBS), and addition of BD Cytofix/Cytoperm solution to fix the cells, and incubation for 10 minutes. After incubation, the cells were washed with PBS, followed by the addition of permeabilizing solution and 10 microliters of TIE2, and incubated for 30 minutes at room temperature. Flow cytometric analysis was done by fluorescence-activated cell sorter (FACS) caliber Flow cytometer (Becton Dickinson Bioscience, San Jose, California). Isotype-matched antibodies were applied with all the samples as controls. Forward and side scatter histograms were used to define the monocytes population 18.
Ang-2 measurement by ELISA: Serum levels of Ang-2 were assayed by ELISA using commercially available kits (Elabscience systems Houston, Texas, USA). The serum obtained from plain blood sample tubes was kept at −80°C and Ang-2 levels in the serum were acquired by ELISA. Absorbance was recorded at 495 nm while Ang-2 concentrations were recorded according to the manufacturer's instructions.
Statistical Analysis
Data was analyzed using IBM SPSS Statistics for Windows version 24 and Medcalc version 18.1. Quantitative data were expressed as means ± standard deviation. Qualitative data were expressed as numbers and percentage. Quantitative data were tested for normality by Shapiro–Wilk test, Mann–Whitney U test, Wilcoxon Signed Ranks test, and Spearman's correlation were used for data which wasn't normally distributed. Independent Samples T-test and Pearson's correlation were used for normally distributed data. Chi-square (χ2) test was used for comparison of qualitative variables as appropriate. Receiver operating characteristic (ROC) curve was constructed for CD 14+, TIE 2+& Ang-2 for optimum cut off point in predicting their levels in HCC patients and the area under the ROC curve value with 95% CI was calculated. Optimal cut off value was determined; sensitivity, specificity, positive predictive value, and negative predictive value were calculated. A p-value of less than 0.05 was considered significant in all statistical tests used in the study.
Results
A total of 112 patients were included in our study and 38 healthy controls classified into 3 groups.
Group I: 78 newly diagnosed hepatocellular carcinoma patients (55males and 23 females); their ages ranged between 46 and 80 (mean 62.45±8.01) years;
Group II: 34 hepatitis C patients (19 males and 15 females); their ages ranged between 48 and 79 (mean 63.77±8.23) years;
Group III: 38 healthy controls (25males and 13 females); their ages ranged between 52 and 77 (mean 61.40±6.71) years.
(Table 1) shows the comparison among studied groups with regards to age, sex, and laboratory parameters.
Table 1. Comparison among studied groups with regards to age, sex, and laboratory parameters.| Group 1HCC(n= 78) | Group IIHepatitis cirrhosis(n= 34) | Group IIIControls(n= 38) | ANOVA*/Chi square** | P value | ||
| Age | 62.45±8.01 | 63.77±8.23 | 61.40±6.71 | 0.839* | 0.434(NS) | |
| Sex | Male | 55(70.5%) | 19(55.9%) | 25(65.8%) | 0.918** | 0.632(NS) |
| Female | 23(29.5%) | 15(44.1%) | 13(34.2%) | |||
| WBCs | 7.00±3.20 | 5.93±1.89 | 6.34±1.69 | 2.210* | 0.113(NS) | |
| HB | 10.05±1.71 | 12.79±2.25 | 13.58±1.41 | 60.467* | <0.001(HS) | |
| PLT | 110.03±54.84 | 191.21±69.12 | 253.61±55.26 | 81.577* | <0.001(HS) | |
| PT | 16.29±2.09 | 12.59±1.10 | - | 94.935* | <0.001(HS) | |
| PC | 56.86±14.26% | 77.47±8.11% | - | 62.080* | <0.001(HS) | |
| AST | 119.62±119.74 | 40.74±14.86 | - | 14.583* | <0.001(HS) | |
| ALT | 74.41±87.32 | 43.03±14.44 | - | 4.318* | 0.040(S) | |
| CD14 % | 31.74±16.58 | 13.35±5.42 | 6.61±2.16 | 60.110* | <0.001(HS) | |
| TIE 2 % | 7.32±4.80 | 2.65±0.89 | 2.02±1.10 | 37.680* | <0.001(HS) | |
| Ang-2 ( pg /ml) | 3216.53±2427.59 | 1932.00±1090.12 | 801.18±416.98 | 22.879* | <0.001(HS) | |
| AFP | 1233.3±1746.8 | 75.15±50.58 | 62.61±39.79 | 15.560 | <0.001(HS) | |
According to this table, highly significant decreased values of hemoglobin, platelets and prothrombin concentration (PC) were found in groups I and II as compared to the control group
A highly significant rise in AST and ALT were detected in HCC patients group (I), in comparison to the cirrhotic group (II). Also, CD 14, TIE2, and angiopoietin 2, Alpha-fetoprotein were significantly increased in the HCC patients group (I) than in both groups (II) and (III).
(Table 2) shows correlation between angiogenetic markers CD14 (%), TIE2 (%), and Ang-2 (pg/ml), and laboratory results in group (I) HCC (N= 79)
Table 2. Correlation between angiogenetic markers CD14 %, TIE2 %, and Ang-2pg/ml, and laboratory results in group I HCC N= 79| CD 14% | TIE2 (%) | Ang-2 (pg/ml) | ||
| Age | Pearson Correlation | 0.232 | -0.051 | -0.106 |
| P value | 0.041 (S) | 0.660 | 0.354 | |
| WBCs | Pearson Correlation | -0.254 | 0.024 | 0.079 |
| P value | 0.025 (S) | 0.832 | 0.490 | |
| HB | Pearson Correlation | 0.294 | -0.022 | -0.064 |
| P value | 0.009 (S) | 0.849 | 0.580 | |
| PLT | Pearson Correlation | -0.102 | -0.470 | -0.286 |
| P value | 0.372 | <0.001(HS) | 0.011 (S) | |
| PT | Pearson Correlation | 0.076 | 0.164 | 0.156 |
| P value | 0.509 | 0.150 | 0.172 | |
| PC | Pearson Correlation | -0.171 | -0.157 | 0.192 |
| P value | 0.135 | 0.171 | 0.093 | |
| AST | Pearson Correlation | 0.022 | 0.019 | -0.168 |
| P value | 0.850 | 0.868 | 0.141 | |
| ALT | Pearson Correlation | -0.205 | -0.201 | -0.129 |
| P value | 0.071 | 0.077 | 0.262 | |
| Total Bilirubin | Pearson Correlation | -0.007 | 0.273 | -0.065 |
| P value | 0.948 | 0.015 | 0.569 | |
| Direct Bilirubin | Pearson Correlation | 0.039 | 0.156 | -0.095 |
| P value | 0.735 | 0.172 | 0.410 | |
| Albumin | Pearson Correlation | 0.149 | 0.210 | 0.036 |
| P value | 0.193 | 0.065 | 0.757 | |
| AFP | Pearson Correlation | -0.188 | 0.001 | 0.263 |
| P value | 0.099 | 0.991 | 0.020 | |
There was significant positive correlation between the age of the patients and CD14 (%) (r = 0.232; p = 0.041), there was negative significant correlation between CD 14 and WBC count (r = -0.254; p = 0.025), there was significant positive correlation between haemoglobin concentration of the patients and CD14 (%) (r = 0.294; p = 0.009),
There was highly significant negative correlation between TIE2 (%) and Plts (r = -0.470; p = 0.001), there was significant positive correlation between TIE (%) and total bilirubin (r = 0.273; p = 0.015)
While there was significant negative correlation between Angiopoietin2 pg/ml and Plts (r = -0.286; p = 0.011), there was positive significant correlation between Ang-2 and serum AFP (r=0.263; p=0.020) while there was no significant correlation between angiogenetic markers (CD14 (%), TIE2 (%) and Angiopoietin2 (pg/ml) and laboratory results in group (I).
(Figure 1) show dot plot CD14+ monocytes CD14 FTIC vs TIE2 PE co-expression in three different participants; one from each group.
Figure 1.A. Forward Scattering (Normal control)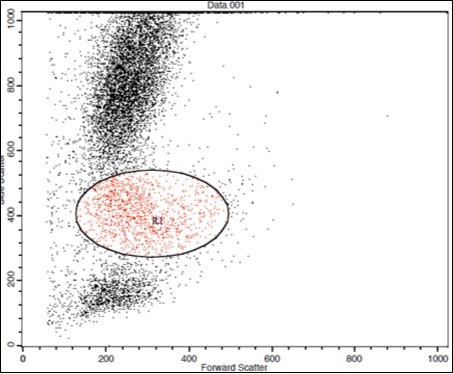
Figure 1.B. Forward Scattering (LC Patient)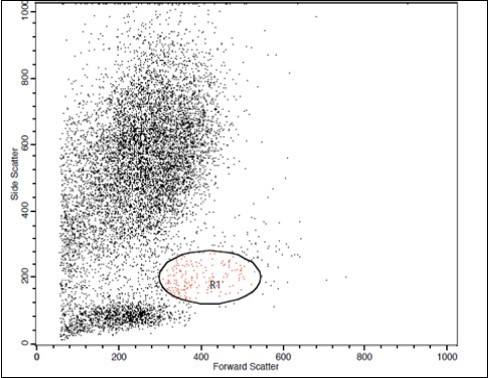
Figure 1.C. Forward Scattering (HCC Patient)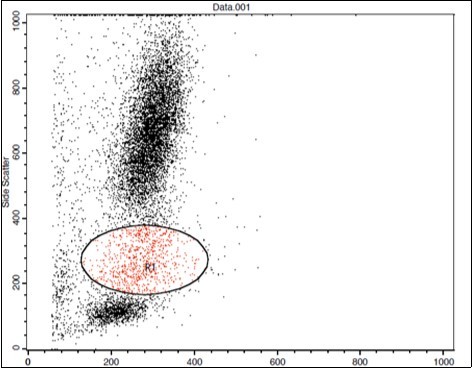
Figure 1.D. Normal control CD 14 & Tie2 co expression 2% & isotopic control.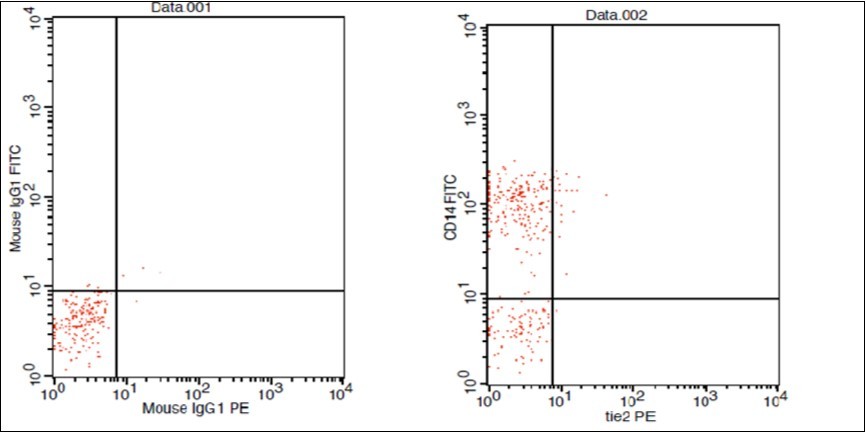
Figure 1.E. LC Patent CD 14 & Tie2 coexpression 4% & isotopic control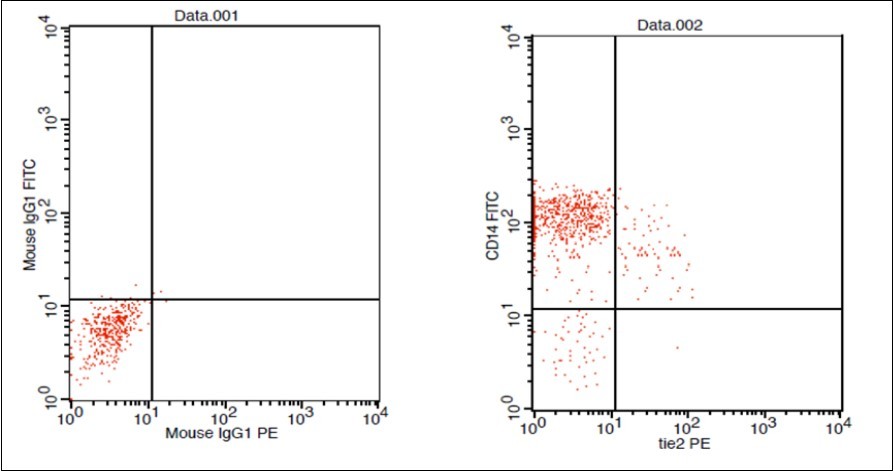
Figure 1.F. HCC Patient CD 14 & Tie2 coexpression 10% & isotopic control.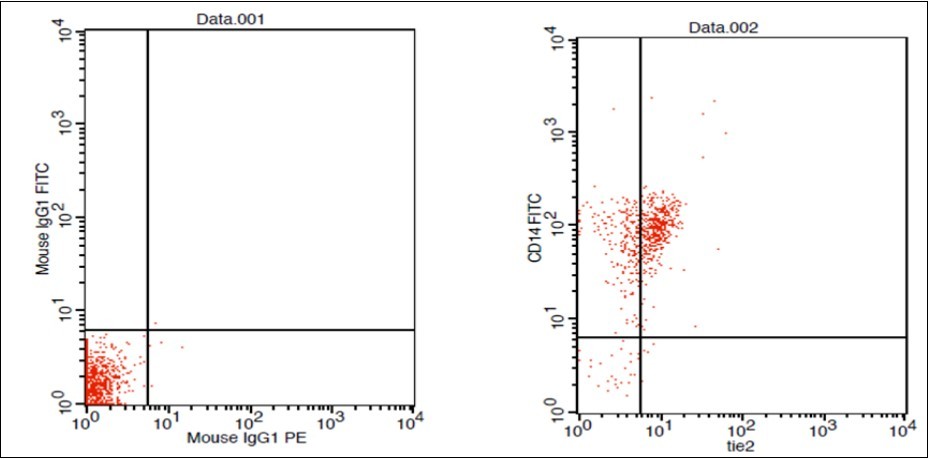
In Table 3, using univariate regression analysis for possible predicting factors for HCC (compared to both positive and negative controls), we included all the demographics and laboratory data of the study groups in univariate regression analysis, with the output result considered to be HCC. This table showed that CD14+, TIE2+, and Ang-2 could be considered predicting factors for HCC.
Table 3. Univariate Regression Analysis for possible predicting factors for HCC compared to both positive and negative controls| Item | P value | Odd's ratio | CI of Odd's ratio |
|---|---|---|---|
| Age | 0.959 (NS) | 0.999 | 0.958-1.041 |
| Male sex | 0.226 (NS) | 1.522 | 0.772-3.001 |
| WBCs | 0.051 (NS) | 1.136 | 1.000-1.292 |
| HB | <0.001 (HS) | 0.407 | 0.307-0.539 |
| PLT | <0.001 (HS) | 0.973 | 0.964-0.981 |
| PT | <0.001 (HS) | 4.847 | 2.438-9.638 |
| PC | <0.001 (HS) | 0.836 | 0.779-0.898 |
| AST | <0.001 (HS) | 1.045 | 1.020-1.069 |
| ALT | 0.038 (S) | 1.016 | 1.001-1.032 |
| CD14 | <0.001 (HS) | 1.275 | 1.181-1.376 |
| TIE 2 | <0.001 (HS) | 2.321 | 1.724 -3.125 |
| Ang-2 | <0.001 (HS) | 1.001 | 1.000-1.001 |
| AFP | 0.002(S) | 1.006 | 1.002-1.010 |
In Table 4 multivariate regression analysis for possible independent predicting factors for HCC among routing investigations, CD14, TIE 2 and Ang-2
Table 4. Multivariate Regression Analysis for possible independent predicting factors for HCC among routing investigations, CD14, TIE 2 and Ang-2.| Item | P value | Odd's ratio | CI of Odd's ratio |
|---|---|---|---|
| CD14 | <0.001 (HS) | 1.203 | 1.106-1.309 |
| TIE 2 | 0.019 (S) | 1.661 | 1.087-2.539 |
| Ang-2 | 0.003 (S) | 1.001 | 1.000-1.001 |
| HB | 0.039 (S) | 0.375 | 0.148-0.953 |
| PLT | 0.374 (NS) | 0.975 | 0.922-1.031 |
| PT | 0.557 (NS) | 1.777 | 0.261-12.077 |
| PC | 0.195 (NS) | 0.685 | 0.386-1.214 |
| AST | 0.087 (NS) | 1.123 | 0.983-1.283 |
| ALT | 0.234 (NS) | 0.946 | 0.863-1.037 |
Using the items which showed significant results in Table 3 in a multivariate regression analysis showed that only HB is significant from routine investigations, while CD14, TIE2, and Ang-2 could be considered as independent predicting factors for HCC. Moreover, analysis of the p-value and the odd's ratio showed that CD14 has higher predictive power for HCC.
Analysis of the ROC curve (Figure 2) showed that the cut-off point for CD14+is14.25, with a sensitivity of 89.7% and a specificity of 83.3%. Cut off point for TIE2+ is 3.45, with a sensitivity of 76.9% and a specificity of 83.3%. The cut-off point for Ang-2 was 1240, with a sensitivity of 76.9% and a specificity of 66.7%. The cut-off value for AFP was 89.5, with a sensitivity of 66.7% and a specificity of 77.8%
Figure 2.ROC curve analysis to differentiate cases from controls both positive and negative controls.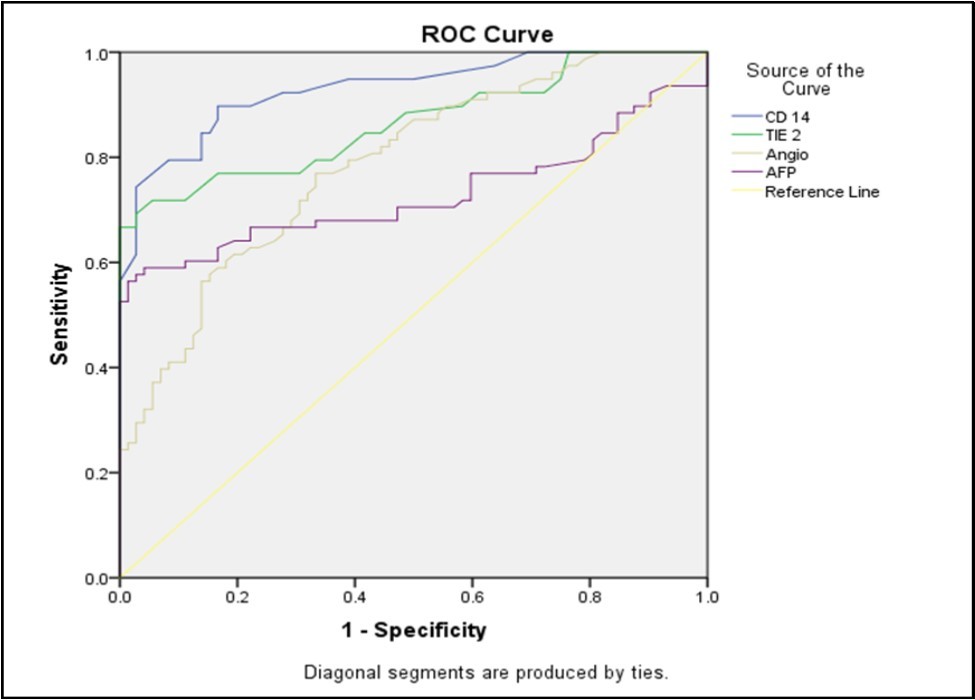
Discussion
Due to the increasing incidences of many liver disorders that can develop HCC and due to the limited treatment options and the poor efficacy of most of them in later stages of the disease course; it is mandatory to find suitable screening methods for early detection of HCC in order to improve the outcome of this major health hazard 7. Tumor-associated macrophages (TAMs) differ from monocytes by being able to secrete many substances including cytokines, growth factors necessary for tumor growth and angiogenic factors as a vascular endothelial growth factor (VEGF) which promoting tumor angiogenesis 19.
We found the following in our data analysis, hemoglobin level and platelet count were significantly lower in the HCC group compared with HCV related LC and control group (p≤0.001), this was agreed by Pratt and Kaplan who stated that thrombocytopenia was highly due to portal hypertension with attendant congestive splenomegaly 20. We found that the prothrombin concentration was statistically lower in patients with HCC and patients with cirrhosis (p≤0.001) compared to controls which could be explained by the decreased synthesis of coagulation factors by the diseased liver. This agreed with what was reported by Youssef et al 21 &Tripod et al 22 who noticed defective utilization of vitamin K in advanced liver disease. Concerning Ang-2 levels in different groups: serum levels were significantly higher in HCC patients (3216.53±2427.59) than in HCVLC patients (1932.00±1090.12) and healthy controls (801.18±416.98) (p≤0.001). This was agreed by Youssef et al, who reported that the serum Ang-2 in the HCC group was (11142.5±6222.8 pg/ml) while in the cirrhosis group it was (6230.3±3053.4 pg/ml) and in the control group, it was (546.8±199.5pg/ml) (p≤0.001). This is following our results. Hunter et al 23 also reported serum Ang-2 in the HCC group (10855 ± 5321.92 pg/ml) when compared with the cirrhosis group (5578.33±2928.21 pg/ml) and the control group (480.67±202.3 pg/ml) (p< 0.001). Badran et al 24 also reported elevated angiopoietin-2 levels in HCC patients compared to LC and healthy controls (1671.6±284.2 vs1416.6±502.7 and 194.97±76.9 ug/ml respectively (P < 0.0001).
Concerning the correlation between laboratory data, there was no significant correlation with serum Ang-2 levels in HCC groups, except a negative significant correlation between platelet counts and serum Ang-2. Also, we found a significant and positive correlation between serum Ang-2 and serum AFP in HCC patients group. This was in discordance with Scholz et al 25 and Youssef et al 21 who failed to find any correlation between both markers among patients with HCC. Concerning the percentage of the circulating TEMs: CD14+ and TIE2+ monocytes were significantly increased in the peripheral blood of HCC patients than HCV LC patients and healthy controls, in agreement with Matsubara et al 26 who found a higher percentage of circulating TEMs in HCC on top of HCV patients compared to HCV patients or healthy controls. To assess the significance of TEM levels as a diagnostic marker of HCC, we did a correlation between TEM level and HCC clinical marker alpha-fetoprotein AFP and found no significant correlation which was in agreement with Matsubara et al 26. There was a higher level of CD14+in HCC patients than in LC group, Guo et al agreed with this in spite of deference of detection method of CD14+ as he also found it to be superior to alpha-fetoprotein in the detection of HCC 27. ROC curve analysis was done in this study for serum Ang-2, CD14+, and TIE2+ to differentiate cases from controls which revealed a cut-off point for CD14+ of 14.25, with a sensitivity of 89.7% and a specificity of 83.3%. Cut off point for TIE2+ of 3.45, with a sensitivity of 76.9% and a specificity of 83.3%. Cut off point for Ang-2 of 1240, with a sensitivity of 76.9% and a specificity of 66.7%. All with highly statistically significant analyses, TEM frequency (CD14+ and TIE2+) was superior to Ang-2 levels as a diagnostic marker for HCC and these results are consistent with Matsubara et al 26 who found that ROC curve analysis revealed that TEM was superior to both AFP and Ang-2 levels as a diagnostic marker for HCC. We used the binary logistic regression analysis to identify predictors of an unfavorable outcome and we found that CD14+, TIE2+, and-2 could be used as predictive of such.
Conclusion
Proangiogenic markers TEM and serum Ang-2 levels were elevated more in HCC patients than in patients with liver cirrhosis and in normal control and they were superior to AFP in the detection of HCC. We can consider a cut-off point for CD14+of 14.25, with a sensitivity of 89.7% and a specificity of 83.3%. Cut off point for TIE2+ of 3.45, with a sensitivity of 76.9% and a specificity of 83.3%. Cut off point for Ang-2 was 1240, with a sensitivity of 76.9% and a specificity of 66.7%. Also, we can conclude that CD14+, TIE2+, and Ang-2 could be used as predictive of bad outcome
Ethical Approval
All procedures performed in the current study were following the ethical standards of the Ethics Committee, Faculty of Medicine, Sohag University, Egypt and with the 1964 Helsinki declaration and its later amendments and comparable ethical standards.
Consent
Consent was taken from the participant after discussion of the study details.
Abbreviation
AFP: alpha-fetoprotein
ALB: albumin
ALT: alanine aminotransferase
Ang-1: angiopoietin-1
Ang-2: angiopoietin-2
AST: aspartate aminotransferase
CBC: complete blood count
ELISA: enzyme-linked immunosorbent assay
FACS: fluorescence-activated cell sorter
FITC: fluoroisothiocyanate
HBV: hepatitis B virus
HCC: hepatocellular carcinoma
HCV: hepatitis C virus
LC: liver cirrhosis
MHC: major histocompatibility complex
Moab: monoclonal antibodies
NAFLD: non-alcoholic fatty liver disease
NASH: non-alcoholic steatohepatitis
PBMC: peripheral blood mononuclear cells
PBS: phosphate-buffered saline
PC: prothrombin concentration
PE: phycoerythrin
p-Tie2: Tie2 phosphorylation
Plts: platelets
RBC: red blood cell
ROC: receiver operating characteristic
RTKs: receptor tyrosine kinases
TAMs: tumor-associated macrophages
TEMs: TIE2-expressing monocytes
Tie: tyrosine kinase receptor
Tie2: tyrosine kinase receptor-2
VEGF: vascular endothelial growth factor.
VEGFR-1: vascular endothelial growth factor receptor-1
χ2: Chi square
Declaration
Ethics approval and consent to participate: Approval for this work was obtained from the Ethics Committee, Faculty of Medicine, Sohag University, Egypt. Samples were taken after obtaining a consent from the patients and controls
Consent for Publication
Not applicable.
Availability of data and materials: All data generated or analyzed during the present study are included in this published article.
Funding
There is no funding received for this work.
Authors' Contributions
1-El-Zahraa M. Meghezel: data collection, patients’ selection, analysis, manuscript preparation and revision.
2-Heba A Ahmed: idea generation, data collection, analysis, manuscript preparation, and laboratory work, revision
3-Ashraf A Askar: data collection, analysis, and manuscript preparation
4-Emad Eldin Nabil: data collection, and manuscript preparation, and revision
5-Ashraf Elyamany: data collection, manuscript preparation, revision, and submission
Disclosure
This paper was presented at the 2018 ESMO Asia Conference as a poster presentation. The poster’s abstract was published Annals of Oncology (2018) 29 (suppl_9): ix46-ix66. 10.1093/annonc/mdy432: Hyperlink with DOI https://oncologypro.esmo.org/Meeting-Resources/ESMO-Asia-2018-Congress/Role-of-Tie2-CD14-angiopoietin-as-angiogenetic-markers-in-hepatocellular-carcinoma-complicating-hepatitis-C-virus-infection-in-Egyptian-patients
Meghezel, E-Z & Ahmed, H & Askar, A & Hassan, E & Elyamany, Ashraf. (2018). 185PRole of Tie2, CD14, angiopoietin as angiogenetic markers in hepatocellular carcinoma complicating hepatitis C virus infection in Egyptian patients. Annals of Oncology. 29. 10.1093/annonc/mdy432.037.
Acknowledgements
Not applicable.
References
- 1.w b e. (2017) Cancer Genome Atlas Research Network. Electronic address. , N. Cancer Genome Atlas Research, Comprehensive and Integrative Genomic Characterization of Hepatocellular Carcinoma, Cell 169(7), 1327-1341.
- 3.A P Venook, Papandreou C, Furuse J, Guevara L L de. (2010) The incidence and epidemiology of hepatocellular carcinoma: a global and regional perspective. , Oncologist 15, 5-13.
- 4.WHO World. (2008) Health Organization. Mortality database. WHO statistical information system. Available at:http://www.who.int/whosis.
- 5.Mokhtar N, Gouda I, Adel I. (2007) Cancer pathology registry 2003-2004 and time trend analysis, In: Mokhtar N, Gouda I, Adel I, eds. Malignant digestive system tumors.Cairo:ElsheraaPress. 55-67.
- 6.Y A Ghouri, Mian I, J H Rowe. (2017) Review of hepatocellular carcinoma: Epidemiology, etiology, and carcinogenesis. , Journal of carcinogenesis 16, 1.
- 7.Jelic S, G C Sotiropoulos, Group E G W. (2010) Hepatocellular carcinoma: ESMO Clinical Practice Guidelines for diagnosis, treatment and follow-up, Annals of oncology :. , official journal of the European Society for Medical Oncology 21, 59-64.
- 8.Chen C, Lou T. (2017) Hypoxia inducible factors in hepatocellular carcinoma. , Oncotarget 8(28), 46691-46703.
- 9.S R Nielsen, M C Schmid. (2017) Macrophages as Key Drivers of Cancer Progression and Metastasis, Mediators of inflammation. 9624760.
- 10.Medinger M, Passweg J. (2014) Angiogenesis in myeloproliferative neoplasms, new markers and future directions. , Memo 7, 206-210.
- 11.G D Yancopoulos, Davis S, N W Gale, J S Rudge, S J Wiegand et al. (2000) Vascular-specific growth factors and blood vessel formation. , Nature 407(6801), 242-8.
- 12.Zhang X, Gan L, Pan H, Guo S, He X et al. (2002) Phosphorylation of serine 256 suppresses transactivation by FKHR (FOXO1) by multiple mechanisms. Direct and indirect effects on nuclear/cytoplasmic shuttling and DNA binding. , The Journal of biological chemistry 277(47), 45276-84.
- 13.Riabov V, Gudima A, Wang N, Mickley A, Orekhov A et al. (2014) Role of tumor associated macrophages in tumor angiogenesis and lymphangiogenesis, Frontiers in physiology 5. 75.
- 14.Rigamonti N, Kadioglu E, Keklikoglou I, C Wyser Rmili, C et al. (2014) Role of angiopoietin-2 in adaptive tumor resistance to VEGF signaling blockade, Cell reports 8(3). 696-706.
- 15.Eroglu Z, C A Stein, S K Pal. (2013) Targeting angiopoietin-2 signaling in cancer therapy, Expert opinion on investigational drugs 22(7). 813-25.
- 16.T R Mikuls, T D LeVan, Sayles H, Yu F, Caplan L et al. (2011) Soluble CD14 and CD14 polymorphisms in rheumatoid arthritis. , The Journal of rheumatology 38(12), 2509-16.
- 17.Ogawa Y, Imajo K, Yoneda M, Kessoku T, Tomeno W et al. (2013) Soluble CD14 levels reflect liver inflammation in patients with nonalcoholic steatohepatitis. , PLoS One 8(6), 65211.
- 18.A J Schuerwegh, W J Stevens, C H Bridts, S L. (2001) De Clerck, Evaluation of monensin and brefeldin A for flow cytometric determination of interleukin-1 beta, interleukin-6, and tumor necrosis factor-alpha in monocytes. , Cytometry 46(3), 172-6.
- 19.Mantovani A, Sozzani S, Locati M, Allavena P, Sica A. (2002) Macrophage polarization: tumor-associated macrophages as a paradigm for polarized M2 mononuclear phagocytes, Trends in immunology 23(11). 549-55.
- 20.Pratt D, Kaplan M. (1999) Evaluation of the Liver A: Laboratory Tests, In:. Schiff's Diseases of the Liver, Eighth Edition [Eds], Lippincott , Williams Wilkens, Philadelphia 205.
- 21.Youssef E, Ali H, Tawfik A, El-Khouly N. (2015) The Potential Role of Angiopoietin-2 as a Diagnostic Tumor Marker for Hepatocellular Carcinoma Research. In Cancer and Tumor 4(1), 7-14.
- 22.Tripodi A, Salerno F, Chantarangkul V, Clerici M, Cazzaniga M et al. (2005) Mannuccio Mannucci, Evidence of normal thrombin generation in cirrhosis despite abnormal conventional coagulation tests. , Hepatology 41(3), 553-8.
- 23.Hunter S, Hassab-Allaah M, El-Ansary M, M E Shanawani. (2010) Significance of Angiopoietin-2 as a Serum Marker for Hepatocellular Carcinoma. , Journal of American Science 66, 1114-23.
- 24.Badran H, Elshenawy N, Elsaiid M, Rewisha E. (2009) . Serum angiopoietin-2 in Egyptian patients with HCV induced liver cirrhosis and hepatocellular carcinoma, Gut 58 [Suppl II] 492.
- 25.Scholz A, V A Rehm, Rieke S, Derkow K, Schulz P et al. (2007) Angiopoietin-2 serum levels are elevated in patients with liver cirrhosis and hepatocellular carcinoma, The American journal of gastroenterology 102(11). 2471-81.