
Assessment of Prescribing and Dispensing Practices Based on WHO Core Prescribing Indicators in Hospital and Community Pharmacies in Khartoum State - Sudan
Abstract
Background
Rational drug management has become an increasingly important topic in order to make optimal use of the drug budget to offer health services of the highest possible standard. It is important that continuous assessment for rational prescribing and use of drug have to be carried. Objective of this study was to gather data on existing drug prescription and dispensing practices and to evaluate the prescribing and dispensing indicators as described by the WHO.
Method
Observational, cross-sectional, prospective study was designed and conducted to evaluate the performance of hospital and community pharmacies in Khartoum state, related to rational drug use and prescribing and dispensing practices during the period from November 2018 to March 2019. 297 Hospital and community pharmacies from public and private sectors were contacted for carrying out this study survey and the collected data were analysed against WHO standards for core drug use indicators.
Results
The average number of drugs per encounter was 3.98 drugs. Hospital pharmacies had a higher (4.18±1.516) number of drugs prescribed than community pharmacies (3.87±1.331) with significance difference between mean of two types of pharmacies (P = 0.015). The percentage of antibiotic per prescription was (53.7%). Antibiotic prescribing was much higher (54.0%) in the hospital pharmacies compared to (48.6 %) in community pharmacies. The average percentage of injections per prescription at the facilities was found to be (57.6%). The percentage of prescription with written diagnosis was (26%.0) and the percentage of prescriptions with written dose was (78%.0). The average dispensing time was (1.75) minutes, The Percentage of drugs actually dispensed was (55.99%), the average adequacy of labelling of drugs was (30.4%). Overall prescribing and dispensing indicators were higher than WHO standard.
Conclusion
The degree of poly pharmacy was greater than of WHO criteria. The completeness and rationality of prescription was found suboptimal and components were missed.
Author Contributions
Academic Editor: Erfan Babaee, Mazandaran University of Science and Technology, Iran.
Checked for plagiarism: Yes
Review by: Single-blind
Copyright © 2020 Dalia Rabie
 This is an open-access article distributed under the terms of the Creative Commons Attribution License, which permits unrestricted use, distribution, and reproduction in any medium, provided the original author and source are credited.
Competing interests
The authors have declared that no competing interests exist.
Citation:
Introduction
A drug prescription is usually considered as the endpoint of a patient’s visit to a certain healthcare setting. In most situations, it is an instruction that is formally written from a prescriber to a dispenser and is considered to be a medico-legal document that should be written legibly, accurately and completely. Although the prescription format may vary slightly from one country to another, most countries agree on the core elements that should be included in the prescription order during practice.1 Dispensing is the process of preparing and giving medicine to a named person on the basis of a prescription. It involves the correct translation of the instructions of the prescriber and the accurate preparation and labelling of medicine for use by the patient. This process may take place in a community pharmacy setting, hospital, health centre, public or private clinic. Also, it can be carried out by many different kinds of people with a variety of training or background, but during dispensing process, patients’ well-being and their drug-related needs are the primary concern of the pharmacist.2In Pharmacy practice, the missions of the hospital pharmacist ranges from simple dispensing to ensure rights of the patients. These missions also include being part of the medication management in hospitals, which encompasses the entire way in which medicines are selected, procured, delivered, prescribed, administered and reviewed. It also includes optimizing the contribution that medicines make to producing informed and desired outcomes; enhancing the safety and quality of all medicine related processes affecting patients; and ensures the 7 “rights” are respected: right patient, right dose, right route, right time, right drug with the right information and documentation.3
Rational drug use can partly be achieved when there is a rational prescribing of drugs with generic or non-proprietary name, from an Essential Drugs List (EDL) of the healthcare setting (if any) or from the country at large. For drugs to be considered essential, they should meet the healthcare demands of the majority of the population in that catchment area. They are usually selected based on the prevailing disease condition, risk benefit and cost effectiveness ratio (pharmacoeconomic analysis), quality, patient compliance and acceptance. Drugs prescribed with generic name can also increase the availability and affordability of drugs elsewhere 4,5. In this concern; World Health Organization (WHO) has designed standardized core prescribing and patient care indicators to evaluate the trends of drug use in outpatient settings of health facilities. Each core indicators have five components. The prescribing indicators include the degree of poly pharmacy, the percentage of drugs prescribed with generic name, the percentage of encounters with at least one antibiotic and injection and the percentage of drugs prescribed from EDL. Moreover, the patient care indicators include, average consultation time, average dispensing time, percentage of drugs actually dispensed and labelled as well as the percentage of patients' who know how to take the correct dosage. The recommended value of WHO for core prescribing indicators include: average number of drugs per encounter < 2 (1.4-1.8), percent encounters with antibiotics <30% (20-26.8%), and percent encounters with injection(s) < 25% (13.4-24.1%), whereas ideally adopted value for prescribing by generic name and from EDL is 100% each. Coming to the WHO patient care indicators, the average consultation time (>10 min), average dispensing time (>180 s), and the percentage of drugs actually dispensed, labelled and patient knowledge are all ideally 100% 6,7,8. These indicators measure the performance of prescribers and dispensers in key areas concerning rational drug use. The indicators assess prescribing, dispensing and patient use of drugs based on clinical encounters at healthcare facilities for the treatment of different illnesses. These indicator studies are less useful when used for inpatient care. These indicators can be used in dispensaries, health centres and hospitals in both public and private sector 9.
A cross-sectional study from 600 outpatient prescribing encounters from Eastern Ethiopia, using the WHO core prescribing indicators, found that average number of drugs prescribed per encounter was found to be (1.89). The percentage of encounters that contain at least one antibiotic and injection was 304 (50.67%) and 315 (59.16%), respectively. Besides, the percentage of drugs prescribed by generic name and from an Essential Drug List (EDL) of the country was 1055 (93.04%) and 1134 (100.00%), respectively.10Different previous studies conducted in Sudan in 2006, 2012, and 2014, concluded that as the values for the average number of medicines per prescription, injection prescribed and adherence to EML was indicative of irrationality for those studies.11,12,13 The study of 2012; included the largest population data to evaluate the prescribing behaviour in Sudan. From 7377 prescriptions analysed, the average number of drugs per prescription were 2.776 drugs, percentage of generics was 37.3%, percentage of antibiotics 54.3%, percentage of injections 38.6% and the percentage of drugs on the essential drug list (EDL) was 72.8%; the study concluded that the observed irrational prescribing behaviour necessitates the development of certain policies as well as practical and effective implementation mechanisms to promote rational prescribing.13
Rational drug management has become an increasingly important topic in order to make optimal use of the drug budget to offer health services of the highest possible standard. It is important that continuous assessment for rational prescribing and use of drug have to be carried. The objective of this study was to gather data on existing drug prescription and dispensing practices and to evaluate the prescribing and dispensing indicators against WHO standards for core drug use indicators. Hospital and community pharmacies from public and private sectors were contacted for carrying out this study survey.
Method
Study Design, Period and Settings
Observational, cross-sectional, prospective study was designed and conducted to evaluate the performance of hospital and community pharmacies in Khartoum state, related to rational drug use and prescribing and dispensing practices as described by the WHO 9, during the period from November 2018 to March 2019. Khartoum State is the most populous state in Sudan with a total population of about 7.0 million. It is geographically centrally located in the country, and administratively it is divided into 3 main cities and seven localities. The majority of this state's population, about 80%, lives in urban areas. In terms of economic opportunities, it is the most privileged state, as it contains the capital city of the country. In total, Khartoum State has 55 hospital pharmacies and 489 community pharmacies according to the list of licensed pharmacies registered up to 2017 by the State Directorate of Pharmacy. Hospital pharmacies are those pharmacies licensed within the hospital and community pharmacies are pharmacies licensed outside hospitals at the main streets. Pharmacies distributed in the 3 cities approximately in a ratio of 50% in Khartoum city, 30% in Omdurman city and 20% in Khartoum North city. Data from these pharmacies were collected by hospital pharmacy master candidate. The candidate stayed at each selected pharmacy for study at least complete shift (8 hours) to collect required data for each pharmacy. Minimum 10 prescriptions had been reviewed and 10 patients had been interviewed from each pharmacy.
Sample Size
The pharmacies were stratified into either public or private hospital pharmacy and community pharmacy. The sample size was calculated from the total number of both hospital and community pharmacies licensed in 2017 (544), by using the following equations:
Sample Size (SS) = Z2 * (p) * (1-P)/d2
Where: Z = Z value (1.96 for 95 % confidence level), P = percentage picking a choice, expressed as decimal. (0.5 used for sample size needed), c= confidence interval, (0.06=+-6). Accordingly, the sample size required to be visited = 297 pharmacies. This again was stratified between the 3 cities according to the ratio of (50%,30% and 20%). All 297 hospital and community pharmacies in Khartoum state stratified were visited and between 3000 - 4500 encounters were included to guarantee wider coverage and state representation and give more validity and accuracy to the study.
Data Collection Method
Prescriptions were collected from the selected hospital and community pharmacies on the same day of the visit. This was undertaken through interview with patients and review of prescriptions they brought to the pharmacy. Information present on the prescription was transferred to a special designed collection data form modified from WHO indicator form for further analysis. Reliability of the data was ensured by following the WHO guidelines and methods. The form collected data about the facilities 'general characteristics, such as location, facility type, pharmacy type, number of patients and prescriptions per day. Also include data of prescribing indicators that measure aspects of patient treatment using indicators based on WHO medicine use investigation manual, prescribing indicators such as the mean number of patients with prescription per day, the mean number of prescriptions with written diagnosis per day, the mean number of drugs per prescription per day, the proportion of prescriptions with antibiotic, the proportion of encounters with injections and the proportion of prescriptions written dosage. Dispensing indicators form was also filled as a part of data collection form to address key aspects of patient care related indicators based on the WHO manual which include; mean dispensing time per day, the mean consultation time, the proportion of drugs actually dispensed to patients, the percentage of medicines sufficiently labeled and patient’s knowledge on how to follow the right dosage regimen, duration and instructions. All the gathered information collected per the day of visit were summarized and assigned for each facility and compared with WHO parameters.
Operational Definitions
Number of Drugs Prescribed
To quantify the degree of polypharmacy.
Number of Drugs Prescribed by Generics
To measure the tendency for prescribing by generic names.
Percentage of Drugs on EML
To measure the adherence to key strategies such as STG and EML.
Percentage of Patients Prescribed Antibiotics
Address its contribution to antimicrobial resistance.
Percentage of Injections Prescribed
To measure the overused costly and unsafe forms of drug.
Data Analysis
The average number of drugs per prescription was calculated by dividing the total number of drugs by the total number of prescriptions. The percentage of drugs on the EDL and generics were calculated from the total number of drugs, while the percentage of antibiotics and injections were calculated from the total number of prescriptions. All the collected data were checked for accuracy, consistency, omission and irregularities. Then, the data were entered in Statistical Package for Social Sciences (SPSS) version 21.0 (IBM SPSS Inc., Chicago, IL) for statistical analysis was carried out using the descriptive statistics (frequencies, percentages, means and standard deviations) were used. Statistical significance was set at a P-value <0.05. All data was expressed as text, illustrated tables and figures.
Ethical Considerations
Ethical approval was obtained from the Ethical Committee of Graduate College National University-Sudan on their meeting dated 20/10/2018. Written approval for conduction of the study was obtained from the Ministry of Health- Khartoum State Research Administration dated 30/10/2018.
Written approval for conduction of the study was obtained from Ministry of Health in Khartoum State Research Administration. (Private hospital research administration). The patients’ identities were kept confidential and they were assured that any information given would only be used for scientific research. The purpose of the study was explained and they were invited to complete the questionnaire after assuring acceptance. Additionally, to that, we considered the willingness of the pharmacist to participate in the study.
Results
General Information
A total of 297 pharmacies had been visited during the period from November 2018 to March 2019, in a rate of two pharmacies per day. (63%.0) were community pharmacies and (37%.0) were hospital pharmacies. Most of pharmacies (51.2%) were located in Khartoum city, (28.6%) in Omdurman city and (20.2%) in Khartoum North city. Majority of pharmacies (64.6%) had no health insurance services. Regarding type of facilities; (74.4%) were private pharmacies and (25.6%) were public pharmacies. The mean number of patients per day was 212.6, mean number of prescription per day was 181.8, mean number of patients aged <15y per day was 49.0 patients and >15y was 88.0 patients. Majority of visitors were male with mean number of 71.3.
Prescribing Indicators
The average number of drugs per encounter was 3.98 drugs. Hospital pharmacies had a higher (4.18±1.516) number of drugs prescribed than community pharmacies (3.87±1.331) with significance difference between mean of two types of pharmacies (P = 0.015). Both were higher than the WHO standard (1.6-1.8). The public facilities had higher mean number of drugs per prescription (4.06±1.413) than the private facility (3.96±1.407), but with no significant difference in mean between two types of facilities (P-value = 0.325). Khartoum North city had the highest mean number of drugs per one prescription (4.58±1.453), followed by Omdurman city (3.94±1.418) then Khartoum city (3.76±1.236) with significance difference between 3 cities (p-value = 0.001). Pharmacies with health insurance had higher mean number of drugs per one prescription (4.22±1.621), compared to (3.86±1.265) for pharmacies without health insurance (p-value <0.05).
The percentage of antibiotic per prescription was (53.7%). Antibiotic prescribing was much higher (54.0%) in the hospital pharmacies compared to (48.6 %) in community pharmacies but both are higher than the WHO standard of (20.0 - 26.8). The average percentage of injections per prescription at the facilities was found to be (57.6%). Injection use was very high (61.0%) in the hospital pharmacies compared to community pharmacy (53%.0). Overall injection use was higher than WHO standard of (13.4-24.1%). Table 1.
Table 1. Prescribing indicators among the studied facilities.| Prescription Indicator | |||||
| FacilityVariable | Average drugs/ prescription | % encounters with an antibiotics prescribed | % encounters with an injection prescribed | ||
| Mean (±SD) | P value | Average % | Average % | ||
| Location | Khartoum | 3.76 (±1.236) | 0.001* | 57 | 58 |
| Omdurman | 3.94 (±1.418) | 44 | 54 | ||
| Khartoum North | 4.58 (±1.453) | 51 | 54 | ||
| Facility type | Public | 4.06 (±1.413) | 0.325 | 54 | 63 |
| Private | 3.96 (±1.407) | 52 | 54 | ||
| pharmacy type | Community | 3.87 (±1.331) | 0.015 | 48.6 | 53 |
| Hospital | 4.18 (±1.516) | 54 | 61 | ||
| Insurance | Yes | 4.22 (±1.621) | 0.000* | 51 | 57 |
| No | 3.86 (±1.265) | 53 | 55 | ||
(Figure 1) shows that the percentage of prescription with written diagnosis was (26%.0) and the percentage of prescriptions with written dose was (78%.0), and again both indicators were less than WHO standard indicator (100%).
Figure 1.Percentage of encounters prescribed with diagnosis and dose written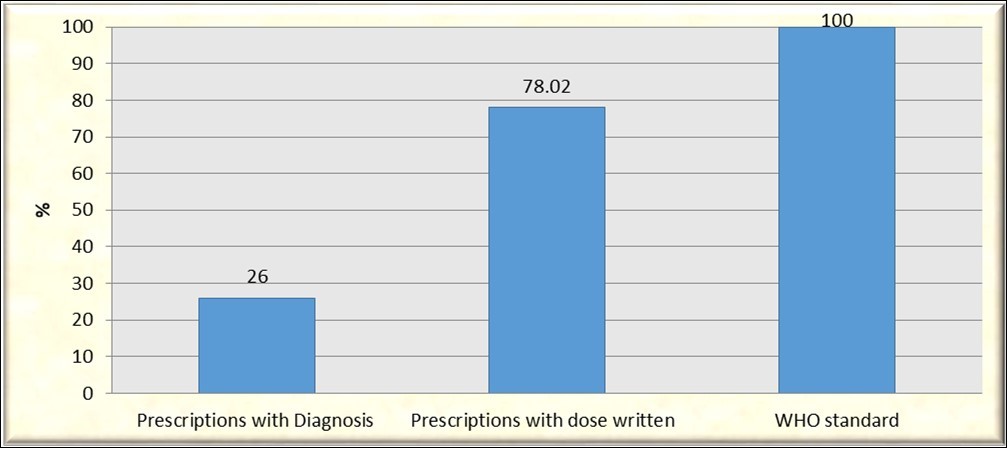
Despising and Patients-Care Indicators
(Table 2) shows the details of dispensing indicators among facilities studied. The average dispensing time was (1.75) minutes (1.75 min and 1.76 min in public and private facilities respectively with no significance difference between two type of facilities (P =0.319). The hospital pharmacies had lower dispensing time of (1.47) minutes than community pharmacies (1.92) minutes with significance difference (P =0.002). The Percentage of drugs actually dispensed was (55.99%), hospital pharmacies were dispensed (64.0%) of the drugs that were prescribed compared with (51.0%) for community pharmacy. Regarding Patient-care indicators; the average adequacy of labelling of drugs was (30.4%). Proper labelling at hospital pharmacies was (65.0%) compared with (35.0%) in community pharmacies. The percentage of patients knowledgeable about the drug dosage was (41.3%). The knowledge by patients in community pharmacies was comparatively higher (44.2%) than hospital pharmacies (36.5%). The percentage of prescription dispensed after validation was (65.05%). Figure 2 shows the average of percentage patient care indicators compared to WHO standard:
Table 2. Dispensing indicators among the studied facilities.| Prescription Indicator | |||||
| FacilityVariable | Average drugs/ prescription | % encounters with an antibiotics prescribed | % encounters with an injection prescribed | ||
| Mean (±SD) | P value | Average % | Average % | ||
| Location | Khartoum | 3.76 (±1.236) | 0.001* | 57 | 58 |
| Omdurman | 3.94 (±1.418) | 44 | 54 | ||
| Khartoum North | 4.58 (±1.453) | 51 | 54 | ||
| Facility type | Public | 4.06 (±1.413) | 0.325 | 54 | 63 |
| Private | 3.96 (±1.407) | 52 | 54 | ||
| pharmacy type | Community | 3.87 (±1.331) | 0.015 | 48.6 | 53 |
| Hospital | 4.18 (±1.516) | 54 | 61 | ||
| Insurance | Yes | 4.22 (±1.621) | 0.000* | 51 | 57 |
| No | 3.86 (±1.265) | 53 | 55 | ||
Figure 2.Average of percentage Patient-care indicators compared to WHO standard.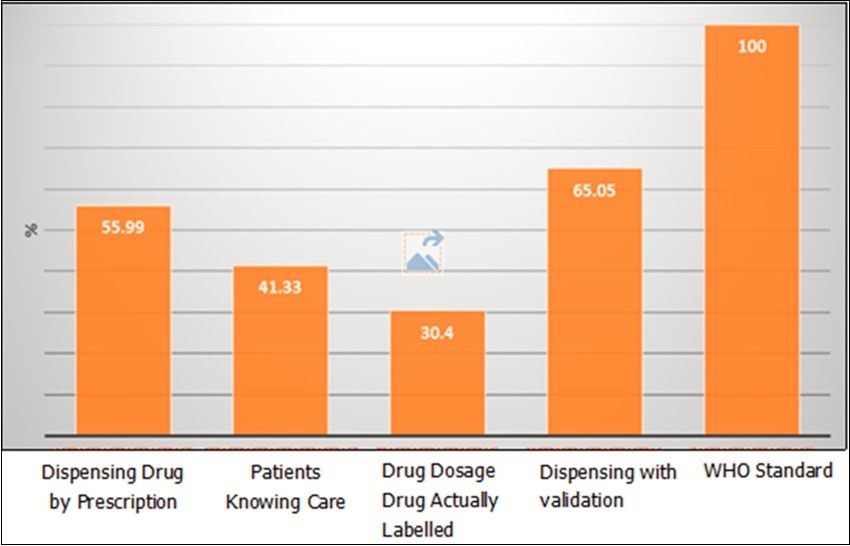
Discussion
The legality, validity, reliability and completeness of prescription papers have overwhelming influence on rational utilization of drugs throughout the globe. 14This study aimed to give an updated overview of rationality of prescription and dispensing practices through evaluation of WHO core drug use indicators in hospital and community pharmacies in Khartoum State- Sudan. Our study reports that the average number of drugs per prescription was found to be (3.98). The difference between hospital and community pharmacies was statistically significant P = 0.015 (Table 1). This value was higher than WHO standard which mandates the degree of poly-pharmacy be less than or equal to two (ideally, 1.6-1.8) in outpatient settings.9This is finding was higher than average numbers of drugs per prescription documented previously in Sudan (1.9, 2.776, 3) 11,12,13 and different parts of the world (2.4) in United States 15, (2.31) in India 16, (2.1) in west Ethiopia 17, (2.2) in Somali region of eastern Ethiopia 18, (2.3) in Pakistan 19, but less than Bangladesh (4.89) 20. The degree of poly-pharmacy seems unsafe in this study; it requires close monitoring to current prescribing practice. The higher degree of polypharmacy may result in greater risk of adverse drug reactions, drug-drug interactions and extravagancy prescribing.
Major drug use areas given major emphasis by WHO indicator studies are encounters with antibiotic(s) and injection(s). The percentage of encounters with antibiotics prescribed was found to be 53.7% which is too much higher than the upper limit of WHO standard, 30% (ideal range, 20-26.8%)9 This result was found to be less than pervious studies in Sudan (65.0%, 63.0%) 11,21andconsistent with other study (54.3%) 13. Values that are lower than this finding and closer to the WHO standard were reported from different areas of the globe including (30.3%) and (31.8%) in Indian healthcare settings 16,22, (29.14%) and (31.8%) in north and west Ethiopia respectively.23,24 However, several reports indicated that the prevalence of prescriptions containing antibiotics is even more than this finding. 25,26 The over-use of antibiotics is occurring internationally and leads to increase in adverse drug reactions and hospitalization, but also contributes significantly to an increase in antibiotic resistance and Sudan appears no different.
Coming to the injection prescribing practice, the prevalence of prescription containing injections was found to was higher than the admissible range (57.6%) compared to WHO criteria which is generally less than 25% (ideal range, 13.4-24.1%). This finding is more than twice the upper limit of the standard. Better injection prescribing practices were reported from several studies (5.7%, 28.50%, 17.18%, 28.3% 38.1% and 38.6%) in India 16, northwest Ethiopia 23, tertiary care hospital of Bangladesh 20, four selected hospitals of west Ethiopia 17 southern Ethiopia 25, and Sudan13 respectively. On the contrary, higher prevalence of injections was also reported in outpatient setting of Bahawal Victoria Hospital of Pakistan (98.0%)19. In developing countries, up to 56% of primary care patients receive injections. From this, over 90% may be medically unnecessary. Globally, 15 billion injections are given, but half of these injections do not use sterilized needle and syringe, which may result in transmission of potentially infectious diseases. Infections attributable to unsafe injection are hepatitis B (33%), hepatitis C (42%), and HIV (2%). 27,28 Overuse of injections may come from psychological dependence of both patients and healthcare professionals on injections for most diseases. Patients may assume that injections are more effective than any other agents.
The study clearly showed that there are some deficiencies in the quality of prescription writing. Majority of prescriptions (74.0%) don't contain diagnosis and the prescribers often omit writing the diagnosis on the prescription paper. Written dose and duration was missed in (22.0%) of prescription surveyed. A pervious study in Sudan 29, also found that the quality of drug prescribing among hospital doctors had serious deficiencies in comparison with studies done elsewhere.30,31 In the absence of diagnosis, the dispensers simply supply drugs without any know how about the condition to which the drug is going to be issued. However, prescribers have often used prescription in the wrong way. Missing the duration of therapy might result under therapy or over therapy.
Regarding the dispensing and patient care indicators, the average dispensing time was calculated to be 105 secs. The difference between hospital and community pharmacies was statistically significant at p = 0.02 (Table 2). (dispensing time = time when a patient reaches and leaves the pharmacy counter, waiting time not included). This value is below the WHO set point. Moreover, longer dispensing time was reported in different settings. For example, up to (152.3 s) in Ethiopia 33, (150 s) in Zimbabwe34 and (201 s) in Nigerian healthcare settings35. The duration of dispensing time ultimately affects the level of comprehension of patients towards the course of treatment, shorter dispensing time is insufficient to provide complete drug related information to the patients. The percentage of drugs actually dispensed were (55.99%), Figure 2 which shows lower percentage than the ideal WHO standard (100%). The percentage of dispensed drugs was found to be less than the average percent values reported at the tertiary care hospital in Ludhiana, India (100%)36, and Alexandria Egypt (95.5%) 37 However, an inadequate drug supply has its implications on patients’ health status and patient’s convenience and trust in health system. According to this study, the average percentage of drugs adequately labeled were (30.4%). In previous study in Sudan and India it was 37.6% 11 and 43.8% 38. These results have shown deviation from the ideal value of 100%. Labeling is one of the key indicators of good dispensing practice and by any means, adequate labeling ultimately promotes patient awareness about the regimen he/she takes and hence increases treatment adherence. According to our findings shown in Figure 2, (41.33%) of the patients had knowledge of correct dosage schedule for all prescribed drugs. This is much lesser than the optimal value of 100 %. It was higher than that reported in Tanzania (37.9 %) 39 and Malawi (27 %) 40 but much lower than than that reported in KSA (79.3%) 41 Nigeria (93 %)42 and Egypt (94 %)37. Patient’s knowledge of correct dosage is highly beneficial to avoid drug over use and abuse; and prevent adverse effects that harm patient’s health status. A good patient’s knowledge of correct dosage will definitely improve patient care and ultimately affect patients’ health and quality of life.
The large sample size of facilities surveyed, prescriptions and observations, add strength to the work. Data collection from 297 pharmacies was a challenge. The use of WHO core drug use indicators provides a lot of strength to the study. This study has a limitation that the prescription collection was made on only for 1 working day rather than over a long period. Also performing interviews inside the pharmacy facility might have motivated patients to give more positive responses than their real experience. Despite the aforementioned limitations, our study provides insight into the prevalence of irrational dispensing practices and uses of medicines in the capital of Sudan and revealed more worsen patterns of practices compared to previous results conducted in Sudan. Against our expectations, findings revealed that community pharmacies had better rational indicators in most of the encounters than hospital pharmacies. The findings of the present study highlight the importance of considering the monitoring of rational prescribing and dispensing to medicine especially antibiotics; and the value of antibiotic policies in restricting the use of antibiotic agents. A multi-faceted strategy that encompasses education, regulation, and increased financial support is needed at the national level in Sudan.
Conclusion
The overall completeness and rationality of prescription was found suboptimal since some of the key components were missed. The degree of poly pharmacy was greater than of WHO criteria. However, inappropriate use of antibiotics and injections was highly noticeable. These two commonly overused and costly forms of drug therapy need to be regulated closely. Labeling practice has been significantly poor. Several activities recommended to be useful and effective in promoting rational drug use. These are establishing drug and therapeutic committee; problem-based basic training in pharmacotherapy; targeted continuing education; availability, accessibility, and affordability of drugs of a good standard.
References
- 1.Belknap S M, Moore H, Lanzotti S A, Yarnold P R, Getz M. (2008) Application of software design principles and debugging methods to an analgesia prescription reduces risk of severe injury from medical use of opioids".Clin Pharmacol Therapeut;. 84, 385-392.
- 2.H Z Toklu, Akici A, Oktay S, Cali S, S F et al. (2010) The pharmacy practice of community pharmacists in Turkey.Marmara Pharm. J,14: 53-60.
- 3.António Melo Gouveia. (2020) Hospital and clinical pharmacist, present and future roles. Available at: https://docplayer.net/17142621-Hospital-and-clinical-pharmacist-present-and-future-roles.html. , Accessed 20.
- 4.Ofori-Asenso R, Brhlikova P. (2016) Pollock AM Prescribing indicators at primary health care centres within the WHO African region: a systematic analysis(1995- 2015).BMC Public Health,(16):. 724.
- 5.Tsega B, Makonnen E. (2012) Comparative evaluation of drug prescription appropriateness in public and private health institutions of south west Ethiopia: The case of Wolkite Town.IJPSR.(3):. 4922-4928.
- 6.World Health Organization. (2003) Introduction to Drug Utilization Research. Oslo, Norway: WHO International Working Group for Drug Statistics Methodology, WHO Collaborating Centre for Drug Statistics Methodology, WHO Collaborating Centre for Drug Utilization Research and Clinical Pharmacological Services;. Available at:https://apps.who.int/iris/handle/10665/42627
- 7.Health World. World Health Organization and University of Amsterdam.https://www.who.int/drugresistance/Manual1_HowtoInvestigate.pdf (2004) Organization and University of Amsterdam. , Geneva, Switzerland:
- 8.Health World.Organization (WHO). Role of dispenser in promoting rational drug use 2008. available at: www.archives-who.int.
- 9. (1993) World Organization. How to Investigate Drug Use in Health Facilities: Selected Drug Use Indicators. WHO/DAP/93.1.Geneva: World Health Organization;. 1-87.
- 10.Sisay M, Abdela J, Kano Z, Araya M, Chemdi M. (2017) . Drug Prescribing and Dispensing Practices in Tertiary Care Hospital of Eastern Ethiopia: Evaluation with World Health Organization Core Prescribing and Patient Care Indicators.Clin Exp Pharmacol(7): 238-245.
- 11.Awad A I, Himad H A. (2006) Druguse practices in teaching hospitals of Khartoum State. , Sudan.Eur J Clin Pharmacol,62: 1087-1093.
- 12.Kheder S I, Ali H M. (2014) WHO Pharmaceutical Situation Assessment Level II. Health Facilities Survey in Khartoum State [Report]. , Khartoum RDF 1-35.
- 13.Mahmoud R K, Kheder S I, Ali H M. (2014) Prescribing rationality in Khartoum state, Sudan: An update.Sudan Medical Monitor;1;9(2):. 61.
- 14.West S L, Strom B L, Freundlich B, Norman E, Koch G. (1994) Completeness of prescription recording in outpatient medical records from a health maintenance organization.J Clin Epidemiol(47):. 165-171.
- 15.Alkot M, Shaheen H, Hathout H. (2011) Prescribing patterns and errors in family practice: a retrospective study of prescribing records. , J Am Sci 7, 186-190.
- 16.PDS Prakash, Rao V U, Kokiwar P R, Sowmya S, Vishweshwaran G. (2016) A Study to evaluate rationality behind prescription patterns using world health organization prescribing indicators.Indo Am J Pharmaceut Res(6).
- 17.Lenjisa J L, Fereja T H. (2014) A retrospective analysis of prescribing practices through WHO prescribing indicators at four selected hospitals of. , West Ethiopia.J Bioanal Biomed; 6, 29-32.
- 18.Bilal A I, Osman E D, Mulugeta A. (2016) Assessment of medicines use pattern using World Health Organization’ s prescribing, patient care and health facility indicators in selected health facilities in eastern Ethiopia.BMC Health Serv Res(16):. 144.
- 19.Atif M, Azeem M, Sarwar M R, Shahid S, Javaid S. (2016) WHO/ INRUD prescribing indicators and prescribing trends of antibiotics in the Accident and Emergency Department of Bahawal Victoria Hospital, Pakistan.Springer Plus;. 5, 1-7.
- 20.Sultana F, Rahman A, Paul T R, Sarwar M S, Islam A U. (2015) Prescribing pattern and prescription errors: a study at a tertiary care hospital of Bangladesh. Bang Pharmaceut J,(1)8:. 20-24.
- 21.Bannenberg W J, Forshaw C J, Fresle D, Salami A O, Wahab H A. (1991) Evaluation of the Nile province essential drug project. WHO: Geneva; WHO/DAP/91.10. In: How to investigate drug use in health facilities. , Geneva:
- 22.Chandelkar U K, Rataboli P V. (2014) A study of drug prescribing pattern using WHO prescribing indicators in the state of Goa. , India.Int J Basic Clin Pharmacol 3, 1057-1061.
- 23.Admassie E, Begashaw B, Hailu W. (2013) Assessment of drug use practices and completeness of prescriptions in Gondar university teaching referral hospital.IJPSR. 4, 265-275.
- 24.Gebeyehu E, Bantie L, Azage M. (2015) Inappropriate use of antibiotics and its associated factors among urban and rural communities of Bahir Dar city administration. , Northwest Ethiopia.PLoS ONE; 10, 1-15.
- 25.Desalegn A A. (2013) Assessment of drug use pattern using WHO prescribing indicators at Hawassa University teaching and referral hospital, south Ethiopia: a cross sectional study.BMC. , Health Services Research 13, 170-176.
- 26.Christensen R F. (1993) A strategy for the improvement of prescribing and drug use in rural health facilities in Uganda. Ugandan Essential drugs and management program; How to investigate drug use in health facilities. , Geneva: WHO. 74(WHO/DAP/93.1)
- 27.Lenjisa J L, Fereja T H. (2014) A retrospective analysis of prescribing practices through WHO prescribing indicators at four selected hospitals of West Ethiopia. , J Bioanal Biomed 6, 29-32.
- 28. (2014) WHO Antimicrobial Resistance, Global Report on Surveillance. , Geneva, Switzerland: WHO..https://www.who.int/drugresistance/documents/surveillancereport/en/
- 29.Jonathan D Q. (2001) Essential Drugs and Medicines Policy. Geneva, Switzerland: World Health Organization International Pediatrics Association.
- 30.Yousif E. (2006) . Deficiencies in medical prescriptions in a Sudanese hospital.Eastern Mediterranean Health Journal; 12(6), 915-918.
- 31.Kumari R, Idris M Z, Bhushan V, Khanna A, Agrawal M. (2008) Assessment of prescription pattern at the public health facilities of Lucknow district.Indian. , J Pharmacol; 40, 243-247.
- 32.A F Sawalha, W M Sweileh, S H Zyoud, al et. (2010) Analysis of prescriptions dispensed at community pharmacies in Nablus. , Palestine.Eastern Mediterranean Health Journal; 16(7), 788-792.
- 33.Gidebo K D, Summoro T S, Kanche Z K, Woticha E W. (2016) Assessment of drug use patterns in terms of the WHO patient-care and facility indicators at four hospitals in Southern Ethiopia: a cross-sectional study.BMC. , Health Services Research 1(6), 643.
- 34. (2000) MoHCW-Public Sector Survey Harare, directorate of pharmacy services, Ministry of health and child welfare. , Zimbabwe 12, 87-93.
- 35.Tamuno I. (2011) Prescription pattern of clinicians in private health facilities in. , Kano, Northwestern Nigeria.Asian Pac J Trop Dis,(1): 235-238.
- 36.Singh S, Dadhich A P, Agarwal A K. (2003) A study of prescribing practices in a tertiary care hospital using WHO core indicators.Asia. , Pac J Pharmacol; 16(1), 9-14.
- 37.Ola A Akl, Mahalli Azza A El. (2014) Ahmed Awad Elkahky, Abdallah Mohamed Salem. , Egypt. Journal of Taibah University Medical Sciences; 6(1), 54-64.
- 38.Hazra A, Tripathi S K, Alam M S. (2000) Prescribing and dispensing activities at the health facilities of a non-governmental organization.Natl. , Med J India; 13(4), 177-82.
- 39.SED Nsimba. (2006) Assessing prescribing and patient care indicator for children under five years old with malaria and other disease conditions in public primary health care facilities. , Southeast Asian J Trop Med Public Health 37(1), 206-14.
- 40.Gelders S. (2015) World Health Organization. Drug use indicator survey, 1991-Malawi Essential Drugs Programme. http://apps.who.int/medicinedocs/en/d/ Js21679en/. Accessed
Cited by (7)
- 1.Zairina Elida, Dhamanti Inge, Nurhaida Ida, Mutia Davina S., Natesan Arivazhagan, 2024, Analysing of drug patterns in primary healthcare centers in Indonesia based on WHO's prescribing indicators, Clinical Epidemiology and Global Health, 30(), 101815, 10.1016/j.cegh.2024.101815
- 2.Mengistu Getnet, Misganaw Desye, Tsehay Tessema, Alemu Belete Kassa, Bogale Kassahun, 2020, <p>Assessment of Drug Use Pattern Using WHO Core Prescribing Indicators at Outpatient Settings of Governmental Hospitals in Dessie Town</p>, Drug, Healthcare and Patient Safety, Volume 12(), 237, 10.2147/DHPS.S266749
- 3.Rabbani Syed Arman, Sridhar Sathvik B., Safdar Maryam, Rao Padma G. M., Jaber Ammar Ali Saleh, et al, 2023, Assessment of Prescribing Practices and Factors Related to Antibiotic Prescribing in Community Pharmacies, Medicina, 59(5), 843, 10.3390/medicina59050843
- 4.Dereje Beyene, Yibabie Shegaye, Keno Zenebe, Megersa Alemayehu, 2023, Antibiotic utilization pattern in treatment of acute diarrheal diseases: the case of Hiwot Fana Specialized University Hospital, Harar, Ethiopia, Journal of Pharmaceutical Policy and Practice, 16(1), 10.1186/s40545-023-00568-7
- 5.Sema Faisel Dula, Asres Esubalew Delie, Wubeshet Belaynesh Dubale, 2021, Evaluation of Rational Use of Medicine Using WHO/INRUD Core Drug Use Indicators at Teda and Azezo Health Centers, Gondar Town, Northwest Ethiopia, Integrated Pharmacy Research and Practice, Volume 10(), 51, 10.2147/IPRP.S316399
- 6.Alehegn Agumas Alemu, Aklilu Robel Gursm, Tadesse Kaleab Ayalew, Tegegne Bantayehu Addis, Kifle Zemene Demelash, 2021, Assessment of Drug Use Practices Using Standard WHO Indicators in Lumame Primary Hospital, Drug, Healthcare and Patient Safety, Volume 13(), 59, 10.2147/DHPS.S286242
- 7.Mbwasi Romuald, Msovela Kelvin, Chilunda Fiona, Tesha Sia, Canavan Robert, et al, 2024, Comparing pharmacy practice in health facilities with and without pharmaceutically trained dispensers: a post intervention study in Tanzania, Journal of Pharmaceutical Policy and Practice, 17(1), 10.1080/20523211.2024.2323091