
Can Data-Driven Hypotheses Replace the Scientific Method?
Abstract
The rapid growth of data and scientific journals has led to the promotion of data-based hypotheses. Data-driven hypotheses can also be used to establish new scientific laws or confirm existing ones, demonstrating the foundation of this philosophy. To introduce this idea, this article presents a Python-based computational algorithm that can generate system dynamics equations without using working hypotheses.
Article Information
- Received
- Accepted
- Published
Academic Editor: Jinpeng Chen, Department of Computer Science and Technology, Beihang University (BUAA).
Checked for plagiarism: Yes
Review by: Single-blind
Copyright © 2023 Raul Isea
 This is an open-access article distributed under the terms of the Creative Commons Attribution License, which permits unrestricted use, distribution, and reproduction in any medium, provided the original author and source are credited.
Corresponding author: Raul Isea, Fundación Instituto de Estudios Avanzados IDEA, Hoyo de la Puerta, Baruta, Venezuela —
Competing Interests
The authors have declared that no competing interests exist.
Funding
No specific funding statement was provided by the authors.
Data Availability
No data-availability statement was provided by the authors.
Citation:
Introduction
A lot of scientific work is based on the scientific method, which includes several steps such as planning, gathering data, generating predictions using logical reasoning, testing, and eventually reporting the findings, where the data enables us to evaluate our research work.
One of the first people to use the scientific method was the Arab and Muslim physicist Abu al-Hasan ibn al-Hasan ibn Al-Haytham (965–1044), known as Alhazen, the father of modern optics 1, while Isaac Newton popularized the scientific method with the publication called Principia2.
Today, advances in technology have made data available to people all over the world. The National Institute of Biotechnology Information (NCBI) repository is a part of the US National Library of Medicine 3. This database, which was created on November 4, 1988, includes a catalog of scholarly papers relating to biotechnology and medicine, as well as DNA sequence data derived from genes and some other data. All information is freely available at www.ncbi.nlm.nih.gov.
This database includes the nucleotide sequence record, which shows the growth of data from 1992 to August 2023, comprising over 246 million DNA sequences generated by scientists and over 400 million articles in the domains of bio technology and medicine 3.
The publications also increased. A recent example is the statistics on the number of Covid-19 cases, responsible for more than six hundred ninety-five million cases worldwide, with less than seven million deaths by the beginning of September 2023. Daily information on cases and deaths is available on several portals, such as Johns Hopkins University (coronavirus.jhu.edu), Worldometers (worldometers.info), outworldindata (outworldindada.org), World Health Organization (covid19.who.int), to name just a few examples. As with many free-access repositories of scientific works, among the preprint servers we can indicate arXiv, bioRxiv, preprint, agriRxive, AfricArXiv, and so on.
What has the Covid-19 pandemic revealed?
The Covid-19 pandemic emphasizes the speed with which scientific publications are being published, as well as the spread of misleading information in blogs and even scientific papers, giving rise to the problem known as fake news 4. Prashant Pradhan and his Indian partners released a paper on January 31, 2019 where they offered evidence of unusual parallels in the coronavirus sequence with HIV gp120 and Gag proteins, implying that it was a fabricated virus 5.
Serge Horbach of Radboud University Nijmegen submitted a study titled "Article about the pandemic: medical journals are significantly accelerating their publication process on Covid-19" at the pre-publication stage (keep in mind that this is a work that has not yet been peer-reviewed). After reviewing 669 publications published in 14 medical journals, he stated that the time it takes for most articles associated with Covid-19 to be published in scientific journals has been reduced by half 6.
But, all ideas come from the scientific method?
We must keep in mind that not all ideas emerge through the scientific process. Let me recall a few classic non-scientific examples, such as the Archimedes bath incident (287–212 AD). It recalls the account of King Hiero II of Syracuse (306-215 BC), who wished to see if his crown was truly composed of gold. Archimedes attested to this and discovered a solution by bathing in a tin can after noticing a correlation between the amount of water displaced and the body mass.
Another example is Alexander Fleming's (1881–1955) discovery of penicillin in 1928, which paved the way for the development of antibiotics while working with bacterial cultures. When he returned from his vacation, he discovered a petri plate that had been accidently contaminated by a green mold (Penicillium notatum), and with his scientific eye, he recognized the significance of this discovery. This type of chance finding is now known as serendipia.
This was not an isolated occurrence. Other examples include the discovery of X-rays in 1895 by physicist Wilhelm Conrad Roentgen while experimenting with electrons in vacuum tubes, radioactivity in 1896 by Antoine Henri Becquerel, LSD by Albert Hofmann in 1943, aspirin by Felix Hoffman in 1894, and Isaac Newton deducing gravity after falling an apple on his head.
In addition, early notions or ideas are frequently incorrect. Consider the instance of Albert Abraham Michelson and Edward Morley 7, who prepared and carried out an experiment in 1887 to measure the relative speed of the earth with respect to the ether and discovered that their hypothesis was incorrect. Albert Einstein benefited from this observation. Therefore, the data should be the guide to scientific publications. Therefore, the data should be the guide for scientific publications. This approach is not new, as discussed below.
Francis Bacon's contribution
The father of philosophical and scientific empiricism, Francis Bacon (1561–1626), pointed out in his work Novum Organum ("New Instruments") in 1620 that scientific knowledge should not be based on preconceived notions that must be based on empirical data 8, therefore inferences must be drawn from these data, i.e., Bacon argued that science should be technical rather than based on theory or speculation. Furthermore, he argued that knowledge should be constructed by observation and prioritization according to logical principles 8.
Bacon advocated inductive reasoning, the process of drawing conclusions from observations. A notable example of this is Johannes Kepler's (1571–1630) work on planetary motion, until Isaac Newton (1642–1727) was able to publish the laws of universal motion in Principia in 1686 2.
Recently, Chris Anderson (former editor of Wired magazine from 2001 to 2012) published an article titled "The End of Theory: Data Deluge Makes the Scientific Method Obsolete" 9. Basically claims that data and supercomputers will replace the conventional scientific approach, eliminating the need for new hypotheses and theories. In this context, the author believes that we have seen a tendency that may lead to a theoretical science, but this is a topic that has to be researched further in future study.
Anderson emphasizes Craig Venter's case of genome sequencing, in which he effectively sequenced entire ecosystems using ant knowledge gained by sequencing species by using supercomputers and sequencers to generate vast volumes of data 9.
Algorithms to develop data-driven hypotheses
Recently, the possibility of deriving mathematical equations capable of describing the dynamics of a system without considering any operational hypotheses has emerged thanks to the large amount of information and advances in computational programming 10, i.e., a procedure that reverses the scientific method by not using an initial hypothesis.
This initiative was led by Schmidth and Lipson, who used symbolic regression and genetic programming 11, and to date it has been applied to nuclear fusion 12, seismology 13, climate change 14, and recently drugs that can be used to fight Covid-19 15.
As a result, data management is driving the potential of data-driven hypothesis 16 which is an approach that allows us to generate a dynamic solution without any theoretical basis; that is, the objective function capable of explaining the system's behavior is unknown. In other words, this concept is similar to a reverse scientific procedure, with the emphasis on data.
Computational Methodology
This research improves the ability to extract equations from a data-driven dynamic system, which can be broadly summarized in four parts (details 17). The first place arranges the data into a transposed matrix of the observed data. The next step is to create a coefficient library based on non-linear functions using the approach given by Rudy et al. 18. As a result, the system's dynamics are straightforward.
The previous stage is a process of optimizing parameters determined using the LASSO (Least Absolute Shrinkage and Selection Operator) approach, until we eventually have the mathematical expressions that characterize the system.
This method is applied in two examples. The first was to demonstrate that it could determine the dynamics of a system based on the van der Pol equation system, named after the Dutch engineer and physicist Balthasar van der pol (1889–1959) 19. These equations have been used to explain, for example, the potential of action in neurons, in seismology, in electrical circuits, etc.
Remember that a system of equations describing a van der Pol oscillator is described as follows:
where is μ a scalar parameter that governs nonlinearity and amortization.
Figure 1. Numerical solution of the van der Pol equation for μ equal to 0.01 and 2 (text for more details).
Download figure
Figure 1 depicts the numerical results for two alternative values (i.e., μ equal to 0.01 and 2.0) with initial values 0 and 1, respectively. As a result, we proceed to build a solution to the system of equations with five hundred data points generated with it (represented by the orange solid line), and we can verify whether or not it really reproduces the system depicted above.
The second example will derive differential equations that will allow the dynamics of Covid-19 spread to be reproduced based solely on daily records of illnesses and deaths in any country in the world, using the equations anticipated for Brazil and Venezuela from the start. From March 27, 2020, to June 14, 2021, 445 cases were reported in these countries as part of the outbreak.
Results
Applying the methodology described in the previous section, the Python program obtained the following equations:
The solution found actually describes the van der Pol equations obtained from the data without inferring any assumptions from the mathematical model. Also, the value of μ oscillates between 1.998 ± 0.004, i.e., an error of the order of is practically the same equation with which the data was generated.
The second scenario consists of contagions (which will be presented in I) and deaths (D) in two distinct countries, Venezuela and Brazil. The found polynomial solution is represented as follows:
where the coefficients of the system of equations are presented in Table 1, where empty cells correspond to a value of 0.
Table 1. Coefficients obtained from the system of differential equations describing the dynamics of contagion in Venezuela (VEN) and Brazil (B), corresponding to the equations dI/dt and dD/dt, respectively

|

|

|

|

|

|

|

|

|

|

|
| VEN | -3,66 | 7,97 | -7,46 | 13,3 | -8,73 | 17,3 | -26,6 | 9,90 | ||
| BRA | 0,15 | 0,34 | 0,04 | 15,8 | 14,0 | -29,8 | 63,3 | -55,1 | -24,0 | 15,8 |

|

|

|

|

|

|

|

|

|

|

|
| VEN | -4,10 | 7,17 | -1,82 | 18,5 | -18,5 | 15,8 | -24,0 | 8,59 | ||
| BRA | 0,34 | 1,64 | -2,52 | 14,3 | 13,3 | -26,7 | 10,7 | -5,52 | -5,29 |
Figure 2(A) and Figure 2(B) repeat the solution obtained from the system of equations describing Covid-19 infection cases in Brazil and Venezuela from March 2020 to June 2021, respectively. This solution is polynomial. These graphs depict the daily cases of infection in blue and the equation predictions in red. It is worth noting that this process allows the data to be filtered in order to generate this forecast. This set of equations can lead to more generic equations, which will be proven in a subsequent scholarly publication.
Figure 2. Daily case records in (A) Venezuela and (B) Brazil from March 2020 to June 2021. Daily case counts are indcated by blue dots, while forecasts are colored red. Normalized data is shown in black for easy visualization of cases.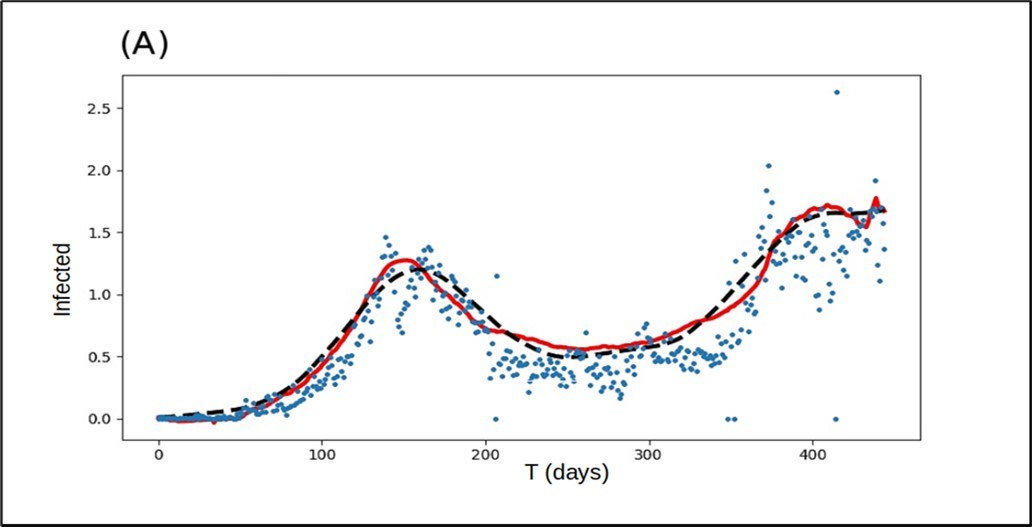
Download figure
Discussions and Conclusion
The paper proposes a computational method based on data-based solutions in which system equations can be evaluated and generated only on data, with no bias introduced into the result. This method is a clear example of a data-driven hypothesis.
The first example in the study was able to reproduce the dynamic equations of the van der Pol oscillator, which are difficult to determine manually without making any assumptions, while in the second example, we gain a polynomial-type equation system that can describe the Covid-19 dissemination dynamics without any epidemiological basis, and we can even make predictions, albeit only in the short term.
Therefore, scientific knowledge must have a strong component of inductive reasoning, which is more data-based than limited to confirming pre-established theories. That is why it is necessary to study how new a discovery is or whether it is simply the result of a theoretical verification.
So it opens up the possibility of reinterpreting and validating scientific laws using data-driven hypothesis, and it is to be hoped that with the rise of Intelligence Artificial, it will be possible to deduce and even revalidate scientific laws for the large volume of information that is being generated around the world.
References
- 2.Newton I.(1846). Newton's Principia : the mathematical principles of natural philosophy. , New-York:Daniel Adee
- 3.Schoch C L, Ciufo S, Domrachev M, Hotton C L, Kannan S et al. (2020) NCBI Taxonomy: a comprehensive pdate on curation, resources and tools.Database. , (Oxford)
- 5.Pradhan P, A K Pandey, Mishra A, Gupta P, P K Tripathi et al. (2020) bioRxiv 2020.01.30.927871; doi: https://doi.org/10.1101/2020.01.30.927871.
- 6.Serge P J M. (2020) Pandemic publishing: Medical journals strongly speed up their publication process for COVID-19.Quantitative Science Studies.1(3): 1056–1067. doi: https://doi.org/10.1162/qss_a_00076
- 7.Michelson A, Morley E W. (1887) . On the Relative Motion of the Earth and the Luminiferous Ether .American Journal of Science.34(203): 333-345.
- 10.Rudy S H, Brunton S L, Proctor J L, Kutz J N. (2017) . Data-driven discovery of partial differential equations.Sci. Adv.3(4):e1602614
- 11.Schmidth M, Lipson H. (2009) Symbolic regression of implicit equations.Genetic Programming Theory and Practice. 10-1007.
- 12.Hatfield P W, Gaffney J A, Anderson G J, Ali S, Antonelli L et al. (2021) The data-driven of high-energy-density physics.Nature,593:. 351-361.
- 13.Bayliss K, Naylor M, Main I G. (2020) Data-driven optimization of seismicity models using diverse data sets: generation, evaluation, and ranking using Inlabru.Journal of Gepphysical Research: Solid Earth.125(11):. 2020-020226.
- 14.Knusel B, Baumberger C. (2020) Understanding climate phenomena with data-driven models.Studies. in History and Phylosophy of Science.A84: 46-56.
- 15.Cippà P E, Cugnata F, Ferrari P, Brombin C, Ruinelli L et al. (2020) A data-driven approach to identify risk profiles and protective drugs. in COVID-19 (2021). Proc Natl Acad Sci USA.118(1):e2016877118. doi: 10.1073/pnas.2016877118. Epub 33303654.
- 17.Silva B M de, Champion K, Quade M, Loiseau J-C, Brunton y et al. (2020) PySINDy: A python package of nonlinear dynamics from data.arXiv:. 2004-08424.