
Core and activating Symptoms of Depression in Chinese Teachers and Comparison between Different Gender and Stage of Teaching: A Network Analysis Approach
Abstract
Background
Depression, increasingly recognized as a critical factor impacting mental health, notably affects various populations, including teachers. This study aimed to delineate the specific characteristics of depressive symptom networks among Chinese teachers, identify the core symptoms of depression within this demographic, and examine the variations in depressive symptom networks across different genders and teaching stages.
Method
The study encompassed 1,670 teachers. Depressive symptoms were assessed using the Self-Rating Depression Scale (SDS). Central symptoms were identified through centrality indices. Network stability was examined via a case-dropping procedure. Directed Acyclic Graphs (DAG) was used to identify the activating symptoms.
Results
“Personal devaluation” exhibited the highest and most stable centrality values in the network. “Depressed Affect” and “Emptiness of Life” were identified as the activating symptoms in the network. No significant differences were observed in the network structure and global strength of depression between teachers of different genders. However, significant differences in the network’s global strength were found between junior and senior high school teachers.
Conclusion
“Personal devaluation” emerged as the core depressive symptoms among teachers in China. “Depressed Affect” and “Emptiness of Life” serve as the gateways that activate the entire teacher depression network. Paying close attention to these symptoms could potentially alleviate the experiences of depression in this demographic.
Article Information
- Received
- Accepted
- Published
Academic Editor: Ian James Martins, Principal Research Fellow Edith Cowan University
Checked for plagiarism: Yes
Review by: Single-blind
Copyright © 2026 Shumeng Ma, et al.
 This is an open-access article distributed under the terms of the Creative Commons Attribution License, which permits unrestricted use, distribution, and reproduction in any medium, provided the original author and source are credited.
Corresponding author: Ning Jia, Department of Psychology, Hebei Normal University, Shijiazhuang 050024, China, College of Humanities Management, Hebei University of Chinese Medicine, Shijiazhuang 050000, China —
Competing Interests
The authors declare that the research was conducted in the absence of any commercial or financial relationships that could be construed as a potential conflict of interest.
Funding
This work was supported by the major project of Humanities and Social Sciences of the Hebei Provincial Department of Education (No. ZD2026022).
Data Availability
The data that support the findings of this study are available from the Science Database of People"s Mental Health but restrictions apply to the availability of these data, which were used under license for the current study, and so are not publicly available. Data are however available from the authors upon reasonable request and with permission of the Science Database of People’s Mental Health.
Acknowledgements
We would like to express our sincere gratitude to the National Center for Medical Informatics for providing valuable data, which can be accessed at https://www.ncmi.cn.
Citation:
Introduction
Depression, recognized globally as a significant mental disorder, has a reported prevalence of approximately 5% among adults worldwide according to the World Health Organization in 2023 1. Individuals suffering from depression are at a significantly higher risk of developing physical ailments, including type 2 diabetes 2, dementia 3, coronary heart disease 4, and even leads to an increased risk of premature death. Recognized as a significant risk factor for depression, work stress has been particularly noted in the teaching profession, a field marked by its high susceptibility 5, 6. The unique challenges faced by teachers, characterized by intense quantitative workload and substantial emotional demands, play a pivotal role in this increased vulnerability 7, 8. These combined pressures not only intensify the stress experienced by educators but also significantly elevate the risk of depression within this profession. The rising student enrollment numbers, stringent teacher evaluation systems, negative public perceptions, and expanding non-teaching responsibilities have collectively heightened stress and depression among educators 9. Depression has been proven to be one of the most common mental health issues among teachers of compulsory education 10. A research effort in Egypt revealed that 23.2% of teachers displayed depression symptoms, with 0.7% experiencing severe depression 11. Similarly, in the United States, the United Kingdom, and other countries, the prevalence of depression among teachers is also high to varying degrees 10, 12, 13. In China, teachers are potentially at an even greater risk due to the comprehensive implementation of school personnel system reforms and various educational reforms over recent decades, which have been linked to an increased risk of depression 14, 15. In several meta-analyses, teachers' depression scores were significantly higher than the national standards for Chinese adults 16. In a survey of English teachers in secondary schools, it was found that 19.4% scored 10 or above on the Patient Health Questionnaire-9 (PHQ-9), indicating a moderate level of depression 12.
For teachers, experiencing psychological distress can have a particularly pronounced effect on both their personal and professional lives 17. Such distress can significantly impact their health and productivity, leading to increased attrition rates
10. Individuals with depression often struggle with meeting interpersonal, time-management, and productivity demands. Additionally, they may face psychological issues, a decline in work quality, frequent absences due to illness, and heightened work disability. These factors collectively can have a profound impact on overall teacher productivity, affecting not only the individual teacher but also the educational environment they are part of 18, 10, 19. The mental well-being of teachers plays a pivotal role in shaping students' learning outcomes 20. Research has demonstrated a significant link between the mental health of educators and student behavior. Prolonged periods of poor mental health in teachers can adversely affect student academic performance and negatively impact the quality of teacher-student relationships 21.
Most quantitative studies on depression have traditionally viewed depressive symptoms as manifestations of a single underlying disorder, analogous to the relationship between a set of items and an underlying latent dimension (such as a factor or trait) in psychometric research. However, this approach has practical limitations, as it often overlooks key aspects like causality, symptom progression, symptom heterogeneity, and the interrelationships among symptoms 22, 23, 24 . Consequently, the intricate complexity of mental health issues is frequently oversimplified by the notion that all symptoms are merely external signs of a singular, underlying disorder 22, 23.
The Network Theory of Mental Disorders (NTMD) posits that symptoms of psychological disorders are interconnected through various mechanisms 25. When these causal connections strengthen, symptoms can form a self-sustaining feedback loop, potentially resulting in a persistent disorder state. NTMD posits that this interconnectedness is a fundamental characteristic of mental disorders. In the context of depression, NTMD views it as a network of interlinked depressive symptoms, arising from complex interactions among multiple risk factors and causal pathways 26, 27. Research in this area has revealed that changes in a single symptom may not directly alter the overall severity but can influence other associated symptoms 28. Targeting a specific symptom could lead to improvements in others 29. Hence, network theory has gained traction as an innovative approach to understanding and treating depression 30, 31, 32. A key methodology in this framework is network analysis, a visualization tool adept at representing such intricate relationships 33, 34. Unlike traditional approaches that aggregate symptom scores to define disorders, network analysis focuses on individual symptoms, mapping the strength and nature of their interconnections 26, 35. Core symptoms, identified based on centrality metrics in the network (such as betweenness, closeness, and strength), are crucial. Interventions aimed at these core symptoms can significantly impact the network, alleviating the mental illness and benefiting peripheral symptoms 26, 36. Consistent with clinical practice, network analysis is used to examine symptom-symptom interactions 37, which is instrumental in identifying intervention priorities and enhancing treatment efficacy, thus offering substantial practical value 38.
Previous research has explored the network structure of depressive symptoms in diverse populations. A study constructing a network model of depression among Chinese adolescents found that the central symptoms included "depressed mood", "feelings of failure", "sadnes", and "fatigue" 38. In contrast, for psychiatric inpatients, they found the core symptoms to be loss of interest, difficulty concentrating, and tiredness/fatigue 32. In a cohort study by 39, it was observed that changes in core symptoms like a sad or depressed mood, diminished interest, and fluctuations in suicidal ideation were intricately connected to shifts in other symptoms. Clinical trials involving adults with major depression have indicated that depressed mood, insomnia, and suicidality are particularly pivotal in determining the effectiveness of antidepressant treatments in terms of remission and recovery 27. Considering the sensitivity of network analyses to sample characteristics such as age, socioeconomic status, and specific stressors, it is crucial to recognize that the applicability of network results might vary across different populations. Therefore, depressive symptoms should be analyzed within the context of specific population groups.
However, the aforementioned network analysis method relies on partial correlations and cannot explore the underlying causal relationships between symptoms. Bayesian Networks (BNs) offer an innovative approach to model causal relationships, addressing the limitations of partial correlation networks in cross-sectional data. We used Directed Acyclic Graphs (DAG) in Bayesian Networks (BNs) to reveal the causal relationships between symptoms within the network. Bayesian Networks measure the likelihood of one event occurring after another through conditional probabilities. This approach allows us to understand the complex relationships between different variables. BNs also incorporate prior probabilities and joint probabilities. Prior probabilities represent the initial belief about the state of each variable before observing any data. These priors are updated with observed data through Bayesian inference, refining our understanding of the network variables. Joint probabilities specify the likelihood of various combinations of observed variable states and quantify the potential causal effects between variables, even in cross-sectional data. The network encodes the joint probability distribution, providing a probabilistic framework for representing and reasoning about causal relationships. Additionally, BNs can identify activating symptoms, which are more likely to influence all other symptoms, and receiving symptoms, which are more likely to be influenced by other symptoms. In network analysis, central symptoms have always been a focal point. However, there is still a gap in analyzing central symptoms: are central symptoms driving the other symptoms in the network, or are changes in other symptoms driving the manifestations of these central symptoms? This is a question of causality, and BNs are a tool that attempts to answer such questions. Previous studies have analyzed depression symptoms based on the Least Absolute Shrinkage and Selection Operator (LASSO) model 40. However, the lack of exploration of causal relationships limited the depth of previous research. In contrast, our study uses DAG in Bayesian Networks to address this limitation. This approach helps reveal the potential directions of symptom associations in the anxiety-depression network, making it possible to visually identify whether central and bridging symptoms are sources or recipients of activation effects. It provides further insights into the underlying structure of anxiety and depression networks, enriching our understanding of teacher depression.
The prevalence of depression in female and male teachers often shows marked differences, with multiple studies indicating higher depression levels in female teachers compared to their male counterparts 41, 42. Additionally, research has demonstrated that high school teachers exhibit significantly higher depression scores than grade school teachers 43. In a Chinese context, a study revealed a gradual but more rapid increase in depression levels among middle school teachers over time, compared to elementary school teachers 44. This raises pertinent questions: Are there notable gender-based differences in the depression network among teachers? Does the depression network vary among primary, junior high, and senior high school teachers? To our knowledge, no prior research has applied network analysis to investigate the relationships among depression symptoms specifically in teachers. Hence, this study used the network analysis to explores the network structure and central symptoms of depression among Chinese teachers and assesses the differences across gender and teaching stages. Although this study focuses on Chinese teachers, high-stress teaching environments, cultural expectations regarding teachers’ roles, and demands for academic achievement are common characteristics across the globe. Moreover, the network analytic approach adopted here is universally applicable and can be employed across diverse cultural contexts to uncover the structure of psychological symptoms 45, 46, 47.
The current study has three objectives. First, we aim to construct the network structure of depression among teachers and identify the central symptoms. Secondly, we compare the networks of male and female teachers to explore gender differences, and we also compare the networks of primary, middle, and high school teachers to investigate the differences among these three groups. Finally, we use Directed Acyclic Graphs (DAG) to reveal potential causal pathways in the depression networks of teachers and identify the activating symptoms.
Methods
Source of data and participants
The data for this study was sourced from the Science Database of People’s Mental Health 48, established by the National Research Institute for Family Planning and managed by the National Population Health Data Center (China). It encompasses data on diverse demographic groups, including children, adolescents, adults, the elderly, individuals with disabilities, pregnant women, and specific occupational groups like teachers and civil servants. For this study, data specifically related to teachers" depression were selected. Analyzed demographic variables included gender and the educational stage taught by the participants. The final sample consisted of 1,670 participants with an average age of 37 years (SD = 10.22 years) and the average length of service was 14 years (SD = 11.12 years), comprising 675 males (40.4%) and 995 females (59.6%). This included 820 primary school teachers
(49.1%), 625 middle school teachers (37.4%), and 225 high school teachers (13.5%). Further descriptive information about the samples can be found in the supplementary materials (Table S1).
Measurements
Depressive symptoms were assessed using the Self-Rating Depression Scale (SDS). This scale comprises twenty items, each rated on a scale ranging from 1 (never) to 4 (always). Of these items, 10 indicate negative experiences and 10 indicate positive experiences 49. The total SDS score can range from a minimum of 20 to a maximum of 80. The total SDS scores were multiplied by 1.25, and the resulting integral part was used as the normal score. A higher normal score suggests a greater tendency towards depression. The SDS have been standardized and shown to be effective in China 50. In this study, the Cronbach’s α coefficient for the scale was 0.90.
Statistical analysis
Network estimation
For statistical analyses, network models were created using R software (Version 4.0.3) (R Team, 2021). In these models, each symptom of depression is represented as a node, and edges between nodes represent regularized partial correlations, reflecting the unique statistical association between two symptoms after controlling for all others 51. The Extended Bayesian Information Criterion (EBIC) along with the graphical Least Absolute Shrinkage and Selection Operator (LASSO) were employed to establish the network of depression symptoms. Specifically, we constructed a network model using the 20 items of the Self-Rating Depression Scale (SDS) as nodes in a Gaussian Graphical Model (GGM) (Costantini et al., 2015). The teacher depression network was estimated using the EBICglasso method by specifying default = ‘EBICglasso’ in the ‘estimate network()’ function of the boot net package. GGM is an undirected network where the edges represent partial correlations between nodes, controlling for the influence of all other nodes in the same network. To eliminate spurious edges and make the model more parsimonious and prominent, the GGM was regularized using the graphical least absolute shrinkage and selection operator (LASSO) penalty, with the final model selected according to the extended Bayesian information criterion (EBIC) 22, 23. The EBIC hyperparameter gamma (γ), which typically ranges from 0 to 0.5 with higher values favoring more parsimonious models by reducing spurious edges 51, was set to 0.5 in this study. Considering that our analysis prioritized robustness of results and was supported by a large sample size (N = 1670), adopting this conservative setting was appropriate. The R packages qgraph (version 1.9.5) 52 and bootnet (version 1.5.6) 53 were utilized for estimating and visualizing the network. The associations between each pair of continuous variables, representing depression symptoms, were calculated using correlation analyses 53 . In the network diagrams, thicker edges indicate stronger associations between nodes. Red edges represent negative associations, while green edges signify positive relationships 52.
To explore the importance of each symptom in the network, previous studies have typically used the centrality index strength (i.e., the sum of the absolute edge weights connected to a specific node), which is considered the most reliable centrality index 54, 55. However, Robinaugh et al. (2016) argued that when a network contains both positive and negative edges, strength may not be a reliable indicator, and expected influence (EI) might be a more reliable metric. Therefore, we used EI in this study to measure the importance of each symptom in the network. Additionally, predictability was calculated using the R package mgm (Version 1.2-14). This measure evaluates how well a node is predicted by its neighboring nodes, serving as an index of the network model’s controllability. Predictability is visually represented by the area within the rings surrounding each node in the network layout 56.
Network stability
The stability of the network was assessed using the R package bootnet (Version 1.5.6) 53 Specifically, we ran 1,000 bootstraps using the `bootnet()` function in the bootnet package, and calculated the CS coefficient by specifying `type= 'nonparametric'` and `nBoot = 1000`. The confidence intervals were set at 95%.The CS-C values determine the maximum proportion of the sample that can be omitted while still maintaining correlations above 0.7 with a 95% probability in relation to the original centrality indices 53. CS-C values above 0.5 are indicative of robust stability, whereas values below 0.25 suggest instability.
DAG
In the DAG, upstream nodes are prioritized as predictors and are considered the causes of downstream nodes 57. Specifically, the construction of the DAG is based on the hillclimb algorithm, using the ‘hc()’ function from the bnlearn package 58. To ensure the stability of the model, the network model is established in three steps 59. First, we performed 50 random starts, with each random start setting 100 perturbations. The purpose of performing 50 different random starts is to avoid local maxima, and the 100 perturbations involve iteratively inserting, removing, or reversing an edge to determine the best-fitting structure of the DAG based on the optimized fitness index (i.e., BIC value). This process allows us to generate an initial DAG based on the data. Next, we bootstrapped 10,000 DAGs to obtain edge frequencies and calculate the significance, direction, and strength of the edges 60. Specifically, if the frequency of an edge exceeds the empirical threshold estimated using the bootstrap networks, it is considered statistically significant and thus retained 59. This approach ensures a good balance between sensitivity and specificity. Finally, the final direction of the retained edges is determined using a majority voting method, where the direction that appears in at least 51% of the arrows in the 10,000 bootstrap networks is considered the final direction of the edge. The thickness of the edges represents the percentage of the final direction appearing in the visualized network.
Comparisons based on gender and educational stage of teaching
Differences in network characteristics based on gender and the educational stages taught were assessed using the Network Comparison Test (NCT) implemented in the R package Network Comparison Test 61. The NCT was applied to subsamples, specifically male and female teachers, as well as primary, junior high, and senior high school teachers. A total of 5000 permutations were conducted to evaluate network invariance, global strength invariance, and centrality invariance across these groups. Due to the smaller number of high school teachers, we down sampled the primary and middle school teachers to match the number of high school teachers for comparison. Down sampling is a data processing method aimed at balancing the dataset by reducing the sample size of the categories with larger sample sizes to match those with smaller sample sizes. This method helps to mitigate bias caused by sample size differences, making the comparison fairer and more accurate 62. Therefore, unlike the overall network estimation and gender-based comparisons that were conducted on the full dataset (N = 1,670), the comparisons across educational stages were performed on the down sampled subsample (675).
Results
Descriptive
The mean SDS score was 2.194 with a standard deviation of 0.841. Descriptive statistics for individual SDS items are shown in Table 1. The results of difference tests between male and female teachers, as well as among primary, middle, and high school teachers, can be found in the supplementary materials (Table S2).
Table 1. Descriptive Statistics of the SDS| Labels | Symptoms | Mean | Standard deviation |
| 1 | Depressed affect | 1.71 | 0.737 |
| 2 | Diurnal variation | 2.73 | 1 |
| 3 | Crying spells | 1.42 | 1 |
| 4 | Sleep disturbance | 1.98 | 0.896 |
| 5 | Decreased appetite | 3.01 | 0.932 |
| 6 | Decreased libido | 2.49 | 1.067 |
| 7 | Weight loss | 1.35 | 0.624 |
| 8 | Constipation | 1.55 | 0.8 |
| 9 | Tachycardia | 1.36 | 0.595 |
| 10 | Fatigue | 1.84 | 0.828 |
| 11 | Confusion | 2.93 | 0.962 |
| 12 | Psychomotor retardation | 2.72 | 0.978 |
| 13 | Psychomotor agitation | 1.56 | 0.719 |
| 14 | Hopelessness | 2.94 | 0.949 |
| 15 | Irritability | 1.81 | 0.815 |
| 16 | Indecisiveness | 2.52 | 0.925 |
| 17 | Personal devaluation | 2.92 | 0.915 |
| 18 | Emptiness | 2.84 | 0.929 |
| 19 | Suicidal rumination | 1.23 | 0.564 |
| 20 | Interest loss | 2.99 | 0.935 |
Network structure
The structure of the depressive symptom network for teachers is depicted in the left side of Figure 1. Of the 190 edges, 110 (57.89%) were positive, demonstrating interconnectedness among the depression symptoms. The strongest connection was observed between “Sense of Futility” and “Emptiness of Life”, followed by the connections “Difficulty in Thinking - Decreased Ability” and “Depressed Affect - Fatigue Easily”. Additionally, node predictability values varied from 57.6% to 93.4%, with an average of 75.0%. This suggests that, on average, 75.0% of the variance in the network nodes could be accounted for by their adjacent nodes. Notably, “Weight Loss” and “Sense of Worthlessness” exhibited the highest predictability within the model, whereas “Emptiness of Life” displayed the lowest predictability.
Figure 1. Network structure of depressive symptoms in teachers and expected influence (z-score) of each variable 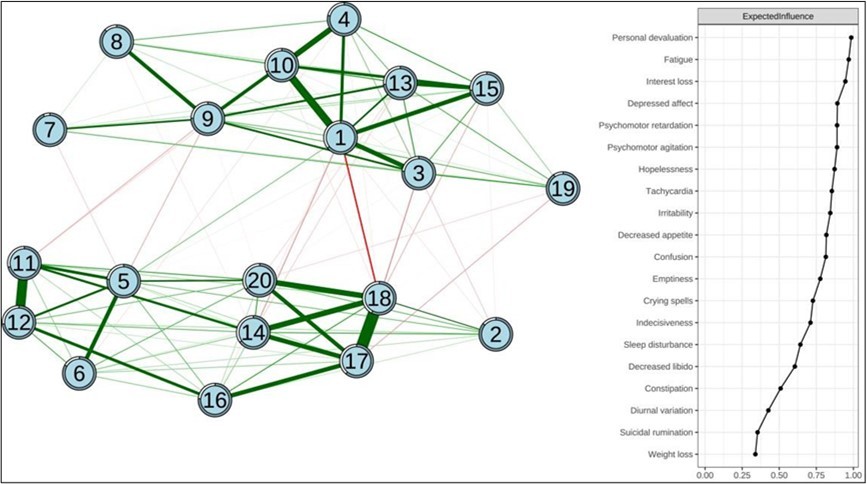
Download figure
The significance of each node within the network is detailed in the right side of Figure 1. The most central symptoms of teacher depression identified were “Sense of futility” (EI = 0.986), “Fatigue” EI = 0.969), “Interest loss” (EI = 0.946), and “Depressed affect” (EI = 0.892). The depression network demonstrated good stability. The CS-C of EI was 0.75, indicating that the EI after discarding 75% of the data was still significantly correlated with the original data at the 95% confidence level (Figure 2). Further information on the edge weight confidence intervals (CI) and differences in node strength for each network can be found in the supplementary materials (Figure S1-S2).
Figure 2. The stability of network structure by case dropping subset bootstrap 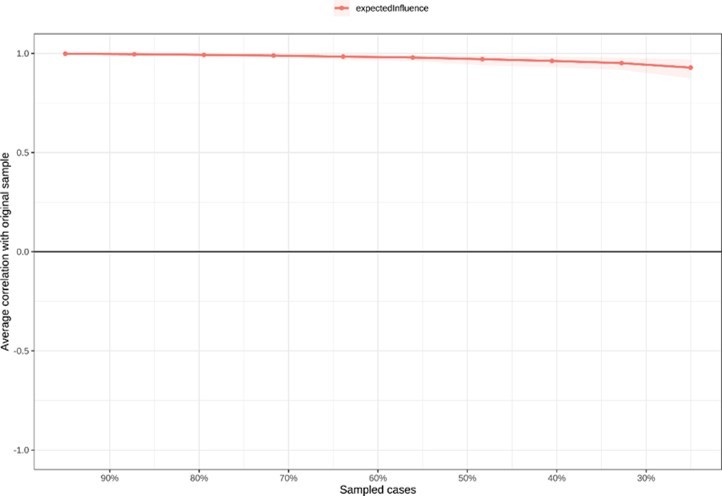
Download figure
Directed Acyclic Graphs
Figure 3 shows the DAG obtained through the hill-climbing algorithm. The symptoms at the top have higher predictability compared to other symptoms. In the DAG visualization, the depression symptoms “Depressed affect” and “Emptiness of life” occupy the highest and second-highest positions, respectively, influencing a large number of symptoms below them.
Figure 3. Bayesian network (directed acyclic graph) of depression 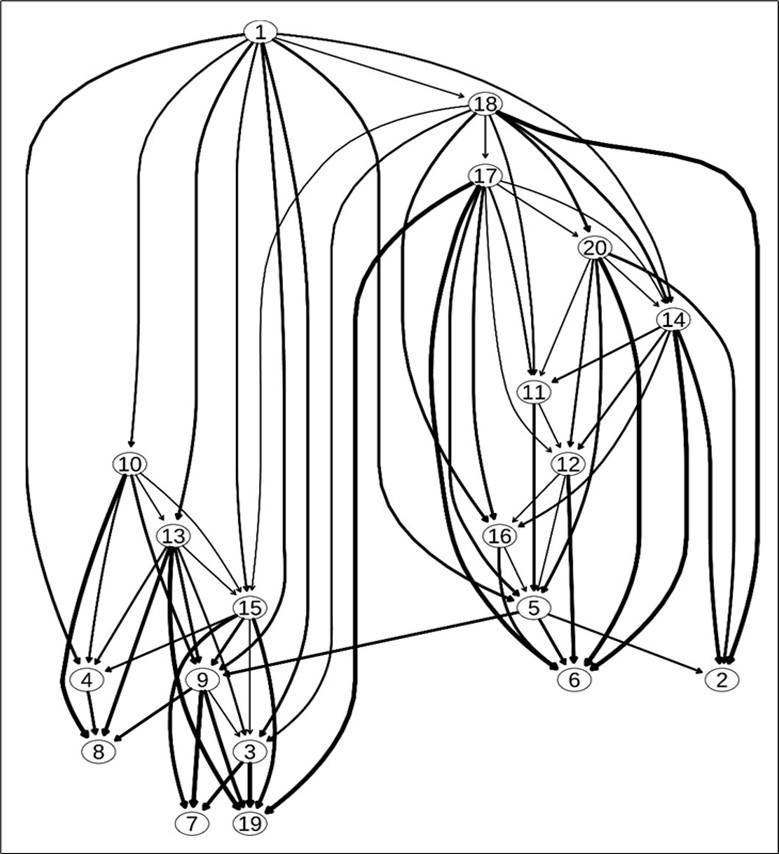
Download figure
Network comparison
Comparisons based on gender
The network structures generated from the two genders are shown in Figure 4. There were no significant gender differences in network global strength (males: 8.79 vs females: 8.51; S = 0.28, p = 0.212) or network structure (M = 0.12, p = 0.717).
Figure 4. Estimated network of depressive in males and females participants.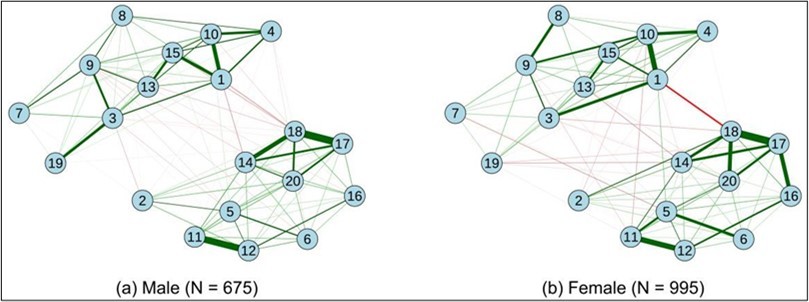
Download figure
In the depression network of male teachers, the most central symptoms included “Sense of futility”, “Loss of interest”, “Fatigue easily”, and “Decreased ability” (Figure 5(a)). However, in female teachers, “Decreased ability” was not a central symptom; instead, “Palpitation of heart” was central (Figure 5(b)). Based on the network comparison, no significant differences were observed in the centrality indices of these core depressive symptoms across the groups (all p values > 0.05).
Figure 5. Centrality plot depicted the expected influence (z-score) of each variable chosen in the male and female teachers. 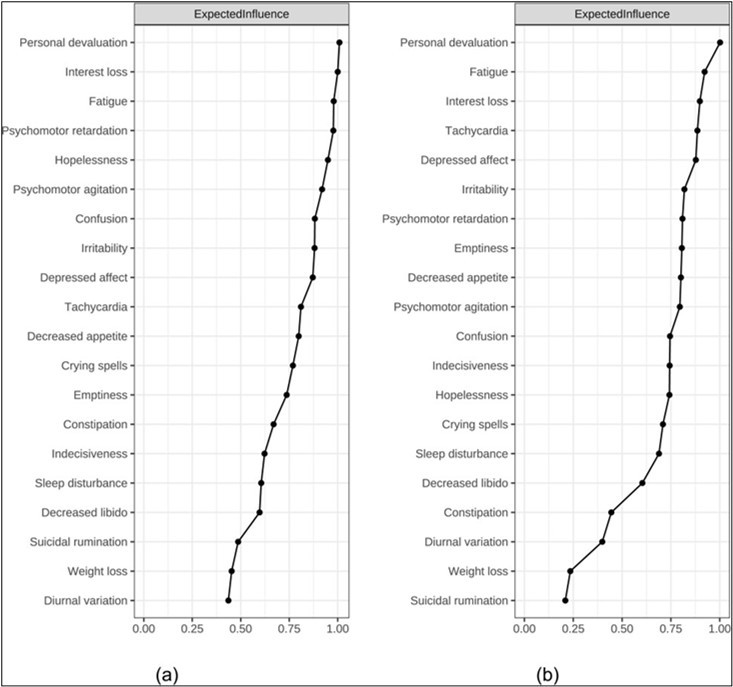
Download figure
Comparisons based on education stages of teaching
Comparisons of network characteristics between primary and junior high school teachers showed no significant differences in global network strength (primary: 8.43 vs junior: 8.77; S = 0.34, p = 0.132) or network structure (M = 0.12, p = 0.794). Similarly, the comparison between primary and senior high school teachers did not reveal significant differences in either global strength (primary: 8.34 vs high: 7.99; S=0.35, p = 0.293) or network structure (M = 0.20, p = 0.680). However, the global network strength was significantly higher in junior high school teachers compared to senior high school teachers (junior: 8.62 vs senior: 7.89; S = 0.64, p < 0.05), although no significant differences were observed in network structure between these two groups (M = 0.18, p = 0.832). No significant differences were observed in the centrality indices of these core depressive symptoms across the groups (all p values > 0.05). The corresponding plots are presented in the supplementary materials (Figure 6).
Figure 6. Estimated network of depressive and anxiety symptoms in primary, junior high and senior high school participants.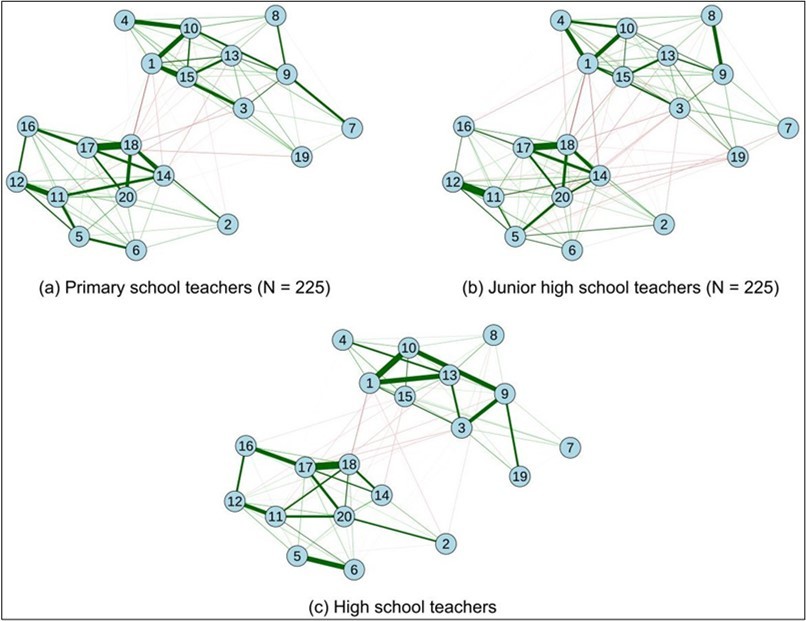
Download figure
Figure 7 displays a comparative analysis of centrality indices among teachers at primary, junior high, and senior high school levels. For primary school teachers, the central symptoms of depression are identified as “Fatigue”, “Personal devaluation”, “Interest loss”, and “Psychomotor agitation” (Figure 7 (a)). In junior high school teachers, the core symptoms include “Personal devaluation”, “Hopelessness”, “Fatigue”, and “Psychomotor retardation” (Figure 7 (b)). Among senior high school teachers, the core symptoms are “Interest loss”, “Personal devaluation”, “Psychomotor agitation”, and “Emptiness” (Figure 7 (c)).
Figure 7. Centrality plot depicted the expected influence (z-score) of each variable chosen in the primary, middle and high school teachers 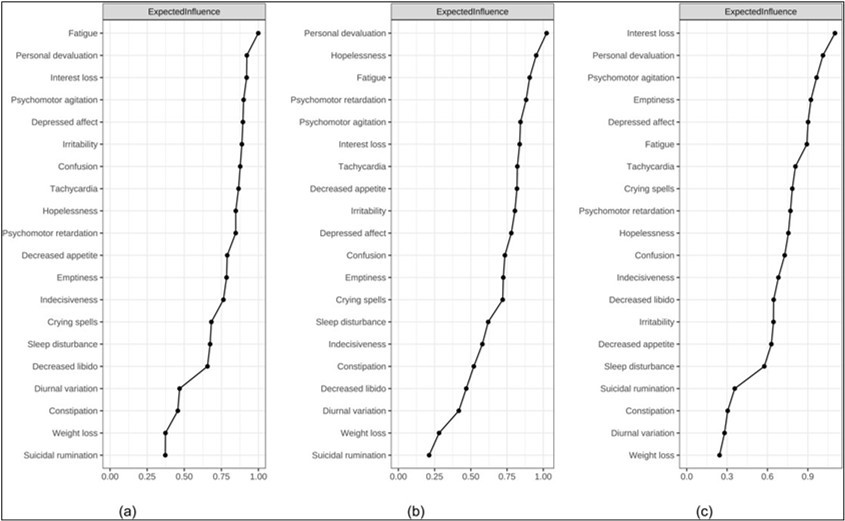
Download figure
Discussion
Considering the increasing prevalence of depression among teachers and its adverse effects on their mental and physical well-being, which in turn may influence student behavior and achievement, this study employed network analysis. The aim was to investigate the core symptoms of depression in teachers, delving into how these symptoms manifest and interact within this specific professional group. Additionally, the study examined variations in the depression symptom network across different genders and stages of teaching, seeking to identify any distinct patterns or characteristics.
To evaluate the core symptoms of teacher depression, one key metrics were utilized: expected influence. The analysis revealed that the most central symptoms of depression among teachers include “Personal devaluation”, “Fatigue”, “Interest loss”, and “Depressed affect”. These symptoms emerged as critical indicators in the network analysis, highlighting their significance in the context of teacher depression.
The centrality indices within the teacher depression network exhibited high levels of stability. The Correlation Stability Coefficients (CS-C) demonstrated robustness, indicating reliable results in the network analysis. In our comparative analysis, it was found that the global strength of the depression network among junior high school teachers was significantly higher compared to their senior high school counterparts.
Core of teachers’ depression
To our knowledge, this study represents the first attempt to characterize the depressive symptom network specific to teachers. Our findings highlight “Personal devaluation” as the most central symptoms within the overall network, consistently emerging as core features across various teacher groups. Consequently, this symptom is the most likely candidates for triggering or maintaining remaining depressive symptoms. The important role of “Personal devaluation” in depression symptoms has been supported by numerous studies 63, 64. A network analysis study focusing on patients with major depressive disorder also confirmed the high centrality of “Personal devaluation”. Exploring “Personal devaluation” among teachers in the Chinese context is particularly meaningful when considering the unique aspects of Chinese culture. In terms of work, Confucian culture in China places a high value on education, with the saying “all trades and professions are inferior to being a scholar” reflecting the high expectations Chinese parents have for teachers and the great hopes society places on them. Additionally, Confucian thought emphasizes that teachers should “serve as a role model”, setting an example for students and nurturing talents that align with Confucian cultural values 65, 66. In the context of family, Confucian familism, a key aspect of Confucian thought, emphasizes the obligations of family members to their families. Under such multiple pressures, Chinese teachers often carry a heavy burden and frequently feel dissatisfied with their achievements, making them more prone to self-devaluation 67. Moreover, the central role of “diminished self-worth” in the depression symptom network provides important insights into understanding depression and occupational burnout among teachers. “Diminished self-worth” reflects an internalized sense of low self-value and a tendency toward self-criticism. It is not only a core symptom of depression but also overlaps with reduced personal accomplishment 68. Research on the mental health of Chinese teachers has shown that depressive symptoms and occupational burnout frequently co-occur at high rates 69, 70. Therefore, early screening and interventions targeting “diminished self-worth” may have particularly significant effects: alleviating this core symptom can help reduce the severity of other depressive symptoms and prevent teachers from falling into a vicious cycle of “worsening depression and progressively deepening occupational burnout.”
Activating symptoms of teachers’ depression
According to the results of the DAG, we identified that “Depressed Affect” and “Emptiness of Life” have significant activating roles in teacher depression symptoms.
“Depressed Affect”, consistently identified as a central symptom of depression 26, 71, 72, 73, has been shown to play a pivotal role across diverse populations and cultures within the core structure of depression networks 73. In this study, “Depressed affect” is also identified as a significant symptom, serving as an important activating symptom rather. Teachers face multiple sources of stress from work, family, and personal life 74, 75, and many are also responsible for administrative duties 76. Excessive stress and heavy workloads exacerbate emotional exhaustion, leading to depressive mood 77 and potentially triggering additional depressive symptoms. Research has already confirmed the impact of depressed affect on the progression of depression symptoms 78, indicating that how individuals cope with depressed affect can significantly influence future psychological outcomes. As an important activating symptom, addressing depressed affect is crucial. In the teacher population, third-wave cognitive behavioral therapies such as Acceptance and Commitment Therapy (ACT) or mindfulness-based cognitive therapy (MBCT) are worth exploring. These therapies can guide teachers to bring more vitality, action, and positive experiences into their lives. Similarly, Behavioral Activation Therapy can help teachers engage in positive activities to counteract depressed affect. The preventive effects of cognitive-behavioral therapy on depression symptoms have received some validation in clinical settings 79. However, their effectiveness in the teacher population has yet to be established.
“Emptiness of Life” emerged as another activating symptom in this study. The professional demands and societal expectations placed on teachers often require them to exercise restraint over their emotions. This includes occasions where they must disguise or conceal their true emotional responses and display emotions that align with their professional roles 80. This disparity between experienced and expressed emotions is termed “ surface acting ” , a concept within the three-dimensional structure of emotional labor 81, 82. The conservation of resources theory posits that such continuous emotional regulation depletes personal affective or motivational resources 83. Over time, this depletion can lead to emotional exhaustion 84, 85, with 'Emptiness of Life' frequently manifesting as a key indicator of this state of exhaustion 86. The findings of this study further emphasize the significant role of “Emptiness of Life” as an activating symptom in teacher depression. The activating role of emptiness identified in the teacher population may be related to the impairment of teachers’ sense of well-being. Emptiness is typically associated with lower levels of well-being 87. A study of primary and secondary school teachers found that the core of teachers' well-being lies in the quality of their interactions with students 88. From this perspective, and in conjunction with our findings, the crucial role of teacher-student interaction offers new insights into the prevention of teacher depression and the construction of psychological health. Development and reform should fully consider the importance of interactions with students.
Depression networks among teachers of different genders
Furthermore, our findings indicate that the network connectivity and structure of depression among teachers are consistent across genders, aligning with previous studies 89. While earlier research has often shown a higher prevalence and overall scores of depressions in females compared to males 90, our network analysis reveals no significant differences between genders in terms of network structure and global strength. This observation might suggest that the centrality of symptoms within the network is independent of the average levels of those symptoms 72. Essentially, while the prevalence and severity of symptoms might differ between genders, the way symptoms are interconnected and influence each other within the network appears to be similar.
Depression networks among teachers of different stage of teaching
This study revealed no significant differences in the structure of depression symptom networks among teachers at various educational stages. This indicates a similarity in how depression symptoms interact and in the fundamental network structure across different groups of teachers, regardless of their teaching stage. Notably, middle school teachers exhibited a higher global strength in their depression symptom network compared to high school teachers. This suggests a more closely knit relationship between depression symptoms among middle school teachers. The junior high school stage, as a transitional period bridging primary and senior high school, places teachers under unique instructional pressures. Academic pressure also intensifies sharply as students begin preparing for competitive examinations, while teachers often face reduced professional autonomy in modifying curricula or pedagogical approaches 91. Moreover, adolescents at this stage frequently experience emotional and behavioral fluctuations associated with puberty, which further complicates classroom management 92. The unique role of the junior high school stage as a transitional period, coupled with the challenges of teaching adolescents, may contribute to a more interconnected network of depression symptoms in middle school teachers. This interconnectedness could lead to stronger feedback loops that sustain depressive symptoms 26, 25, 27. Based on these findings, while similar intervention strategies can be applied to address depressive symptoms in teachers across various educational stages, a greater focus may be needed for interventions targeting middle school teachers, given their higher network global strength.
Strengths and limitation
Recent studies have increasingly focused on the mental health of teachers 93, uncovering that their mental health conditions are far from optimistic 94, 95. Compared to other professions, primary and secondary school teachers are subjected to higher levels of psychological risks 96, with notable concerns regarding the high prevalence and detection rates of depression 97. Among teacher samples, various factors such as work-family conflicts and perceived stress have been identified as contributors to symptoms of depression 98, 99. Given the significance of high centrality symptoms within networks as reported in previous studies 100, 101, our research could be instrumental in developing and testing targeted interventions to mitigate depression among teachers. For example, it would be beneficial to incorporate explicit measures and strategies within teacher management protocols, such as mandatory training and avenues for aligning with school culture and systems. These measures should focus on managing and appropriately expressing emotions, reducing the need for surface acting in emotional labor, thereby diminishing emotional exhaustion and the sense of emptiness in life 48.
Despite the potential applied implications of this study, several limitations must be acknowledged. First, the reliance on self-reported data introduces the possibility of response biases, including social desirability bias. Second, the cross-sectional design of this study limits our ability to infer causal relationships or track the dynamics of depression symptoms over time. Third, the generalizability of our findings may be primarily applicable to Chinese teachers, suggesting that studies in different countries or with different populations might yield varying network structures. Finally, although Bayesian Network (BN) analysis can demonstrate potential causal relationships between symptoms through conditional probabilities, it cannot replace longitudinal study designs. BNs can identify possible causal relationships and suggest potential causal links in correlated data, but they inherently do not provide the temporal order of events. Future research could consider longitudinal network analysis.
Conclusion
Our network analysis successfully identified the core symptoms in the depression network of Chinese teachers: “Personal devaluation”, and the activating symptoms: “Depressed Affect” and “Emptiness of Life”. The study revealed consistency in core symptoms, network connectivity strength, and structure across different genders. Regarding the stage of teaching, notable differences were observed in network global strength between junior and senior high school teachers, with junior high school teachers exhibiting higher network global strength. This suggests that depressive symptoms may be more entrenched and challenging to alleviate among junior high school teachers, highlighting the need for focused interventions in this group to prevent the exacerbation of depression. The study further identified activating symptoms of depression among teachers, namely depressed affect and emptiness of life, which offer a new perspective for the prevention of teacher depression. In clinical practice, timely interventions targeting core symptoms can effectively alleviate overall depression levels, while the early monitoring and management of activating symptoms are particularly crucial for prevention.
Author Contributions
Conceptualization: Shumeng Ma; Data curation: Shumeng Ma; Formal analysis: Shumeng Ma; Funding acquisition: Ning Jia; Methodology: Shumeng Ma, Ning Jia; Supervision: Ning Jia, Jinghua Dai; Visualization: Shumeng Ma; Writing - original draft: Shumeng Ma; Writing - review & editing: Ning Jia, Jinghua Dai. Approval of the final version for publication: all co-authors.
Ethics Statement
The database, approved by the Ethics Committee of the Cancer Hospital, Chinese Academy of Medical Sciences, ensures participant informed consent, with the latest ethics revision dated May 26, 2023.
Preprint Disclosure
A previous version of this manuscript has been deposited as a preprint at Research Square: Ma, S., & Jia, N. (2024). Core Symptoms of Depression in Chinese Teachers and Comparison between Different Gender and Stage of Teaching: A Network Analysis Approach. Research Square Platform LLC. https://doi.org/10.21203/rs.3.rs-3894317/v1
Supplementary Material
Tables & Figures
| Labels | Symptoms | Mean | Standard deviation |
| 1 | Depressed affect | 1.71 | 0.737 |
| 2 | Diurnal variation | 2.73 | 1 |
| 3 | Crying spells | 1.42 | 1 |
| 4 | Sleep disturbance | 1.98 | 0.896 |
| 5 | Decreased appetite | 3.01 | 0.932 |
| 6 | Decreased libido | 2.49 | 1.067 |
| 7 | Weight loss | 1.35 | 0.624 |
| 8 | Constipation | 1.55 | 0.8 |
| 9 | Tachycardia | 1.36 | 0.595 |
| 10 | Fatigue | 1.84 | 0.828 |
| 11 | Confusion | 2.93 | 0.962 |
| 12 | Psychomotor retardation | 2.72 | 0.978 |
| 13 | Psychomotor agitation | 1.56 | 0.719 |
| 14 | Hopelessness | 2.94 | 0.949 |
| 15 | Irritability | 1.81 | 0.815 |
| 16 | Indecisiveness | 2.52 | 0.925 |
| 17 | Personal devaluation | 2.92 | 0.915 |
| 18 | Emptiness | 2.84 | 0.929 |
| 19 | Suicidal rumination | 1.23 | 0.564 |
| 20 | Interest loss | 2.99 | 0.935 |
Figure 1. Network structure of depressive symptoms in teachers and expected influence (z-score) of each variable
Download figure
Figure 2. The stability of network structure by case dropping subset bootstrap
Download figure
Figure 3. Bayesian network (directed acyclic graph) of depression
Download figure
Figure 4. Estimated network of depressive in males and females participants.
Download figure
Figure 5. Centrality plot depicted the expected influence (z-score) of each variable chosen in the male and female teachers.
Download figure
Figure 6. Estimated network of depressive and anxiety symptoms in primary, junior high and senior high school participants.
Download figure
Figure 7. Centrality plot depicted the expected influence (z-score) of each variable chosen in the primary, middle and high school teachers
Download figure
References
- 2.Pouwer F, M J Knol, Snoek F. (2006) Depression as a risk factor for the onset of type 2 diabetes mellitus. , A meta-analysis.Diabetologia 49(11), 2797-2798.
- 3.L V Kessing. (2012) Depression and the risk for dementia [Review].Current Opinion in Psychiatry,25(6). 457-461.
- 4.O'Neil A, A J Fisher, K J, F N Jacka, M A Kotowicz et al. (2016) Depression is a risk factor for incident coronary heart disease in women: An 18-year longitudinal study.Journal of Affective Disorders,196. 117-124.
- 5.Cameron M, A R. (2005) A Meta-Analysis for Exploring the Diverse Causes and Effects of Stress in. , Teachers.Canadian Journal of Education / Revue canadienne 28(3), 458-486.
- 6.J S Lee, E J Joo, K S Choi. (2013) . Perceived Stress and Self-esteem Mediate the Effects of Work-related Stress on Depression.Stress and Health,29(1) 75-81.
- 7.Arvidsson I, Håkansson C, Karlson B, Björk J, Persson R. (2016) Burnout among Swedish school teachers - a cross-sectional analysis.BmcPublic Health,16. 11, 10-1186.
- 8.C H, X L Liao, X Y Jiang, X D Li, I H Chen et al. (2023) Psychometric evaluation of the depression, anxiety, and stress scale-21 (DASS-21) among Chinese primary and middle school teachers.BmcPsychology,11(1). 209-10.
- 9.K S Mackie, C K Holahan, N H Gottlieb. (2001) Employee involvement management practices, work stress, and depression in employees of a human services residential care facility.Human Relations,54(8). 1065-1092.
- 10.Besse R, Howard K, Gonzalez S, Howard J. (2015) . Major Depressive Disorder and Public School Teachers: Evaluating Occupational and Health Predictors and Outcomes.Journal of Applied Biobehavioral Research,20(2) 71-83.
- 11.Desouky D, Allam H. (2017) Occupational stress, anxiety and depression among Egyptian teachers.Journal of Epidemiology and Global Health,7(3). 191-198.
- 12.Kidger J, Brockman R, Tilling K, Campbell R, Ford T et al. (2016) Teachers' wellbeing and depressive symptoms, and associated risk factors: A large cross sectional study in English secondary schools.Journal of Affective Disorders,192. 76-82.
- 13.Soria-Saucedo R, Lopez-Ridaura R, Lajous M, V J Wirtz. (2018) The prevalence and correlates of severe depression in a cohort of Mexican teachers.Journal of Affective Disorders,234. 109-116.
- 14.Li Q, Li Y, X D Zhang. (2021) . Influence of Occupational Stress of Primary and Secondary Schools Teachers on Quality of Mental Life: The Mediating Effect of Psychological Resilience and Self-esteem.China Journal of Health Psychology,29(2) 14.
- 15.F M Xu. (2003) A study on teachers' occupational stress and burnout.Chinese. , Journal of Clinical 11(3), 195-197.
- 16.Y L Zhao. (2015) Changes in the mental health of primary and secondary school teachers in China in the last twenty years Changes in the mental health of primary and secondary school teachers in China in the last twenty years.Journal of Social Psychology,6. 3-13.
- 17.A L Seritan. (2020) How to Recognize and Avoid Burnout. In: Roberts, L. (eds) Roberts Academic Medicine Handbook. , Cham. doi: 10-1007.
- 18.D A Adler, T J McLaughlin, W H Rogers, Hong C, Lapitsky L et al. (2006) Job performance deficits due to depression.American. , Journal of 163(9), 1569-1576.
- 19.S E Lagerveld, Bültmann U, R L Franche, Dijk F J H van, M C Vlasveld et al. (2010) . Factors Associated with Work Participation and Work Functioning in Depressed Workers: A Systematic Review.Journal of Occupational Rehabilitation,20(3) 275-292.
- 20.Embse N von der, S V Ryan, Gibbs T, Mankin A. (2019) . Teacher stress interventions: A systematic review [Review].Psychology in the Schools,56(8) 1328-1343.
- 21.L E Kim, Jörg V, R M Klassen. (2019) . A Meta-Analysis of the Effects of Teacher Personality on Teacher Effectiveness and Burnout.Educational Psychology Review,31(1) 163-195.
- 22.E I Fried, R M Nesse. (2015) Depression is not a consistent syndrome: an investigation of unique symptom patterns. in the STAR* D study.Journal of Affective Disorders,172 96-102.
- 23.E I Fried, R M Nesse. (2015) Depression sum-scores don't add up: why analyzing specific depression symptoms is essential.BmcMedicine,13. 72, 10-1186.
- 24.V D Schmittmann, Cramer A O J, L J Waldorp, Epskamp S, R A Kievit et al. (2013) Deconstructing the construct: A network perspective on psychological phenomena.New Ideas in Psychology,31(1). 43-53.
- 26.Beard C, A J Millner, Forgeard M J C, E I Fried, K J Hsu et al. (2016) Network analysis of depression and anxiety symptom relationships in a psychiatric sample.Psychological Medicine,46(16). 3359-3369.
- 27.Komulainen K, Airaksinen J, Savelieva K, Gluschkoff K, R G Velázquez et al. (2021) Network dynamics of depressive symptoms in antidepressant medication treatment: secondary analysis of eight clinical trials.Molecular Psychiatry,26(7). 3328-3335.
- 28.L F Bringmann, Lemmens L, Huibers M J H, Borsboom D, Tuerlinckx F. (2015) Revealing the dynamic network structure of the Beck Depression Inventory-II.Psychological Medicine,45(4). 747-757.
- 29.Cramer A O J, L J Waldorp, Maas H L J Van Der, Borsboom D. (2010) Comorbidity: A network perspective.Behavioral and Brain Sciences,33(2-3), 137-+.doi:. 10-1017.
- 30.Bai W, H T Xi, Q, M, H Y Zhang et al. (2021) Network analysis of anxiety and depressive symptoms among nursing students during the COVID-19 pandemic*.Journal of Affective Disorders,294. 753-760.
- 31.Gossage L, Narayanan A, J F Dipnall, Iusitini L, Sumich A et al. (2022) Risk factors for depression in Pacific adolescents in New Zealand: A network analysis.Journal of Affective Disorders,311. 373-382.
- 32.M L Rogers, M A Hom, T E Joiner. (2019) Differentiating acute suicidal affective disturbance (ASAD) from anxiety and depression Symptoms: A network analysis.Journal of Affective Disorders,250. 333-340.
- 33.Haslbeck J M B, L J Waldorp. (2018) How well do network models predict observations? On the importance of predictability in network models.Behavior. , Research 50(2), 10-3758.
- 34.Borkulo C D Van, Borsboom D, Epskamp S, T F Blanken, Boschloo L et al. (2014) A new method for constructing networks from binary data.Scientific Reports,4, 5918.doi: 10.1038/srep05918.
- 35.Rouquette A, Pingault J-B, E I Fried, Orri M, Falissard B et al. (2018) . Emotional and Behavioral Symptom Network Structure in Elementary School Girls and Association With Anxiety Disorders and Depression in Adolescence and Early Adulthood: A Network Analysis.JAMA Psychiatry,75(11) 1173-1181.
- 36.Borsboom D, Cramer A O J. (2013) Network Analysis: An Integrative Approach to the Structure of Psychopathology. , In S. NolenHoeksema (Ed.),Annual Review of Clinical Psychology 9, 10-1146.
- 37.M B, Caruso R, Ounalli H, Zerbinati L, Berretti E et al. (2020) The relationship between demoralization and depressive symptoms among patients from the general hospital: network and exploratory graph analysis.Journal of Affective Disorders,276. 137-146.
- 38.S, Y H Luo, X, K W Jian, Z J Xu et al. (2022) . Core Symptoms of Depression in Chinese Adolescents and Comparison between Different Gender and Levels of Depression: A Network Analysis ApproachJournal of Psychological Science,45(5) 1115-1122.
- 39.Savelieva K, Komulainen K, Elovainio M, Jokela M. (2021) Longitudinal associations between specific symptoms of depression: Network analysis in a prospective cohort study.Journal of Affective Disorders,278. 99-106.
- 40.Kaiser T, Herzog P, Voderholzer U, E L Brakemeier. (2021) Unraveling the comorbidity of depression and anxiety in a large inpatient sample: Network analysis to examine bridge symptoms.Depression and Anxiety,38(3). 307-317.
- 41.Johansson E, Falkstedt D, Almroth M. (2022) Depression among teachers: a Swedish register-based study.BmcPublic Health,22(1). 355, 10-1186.
- 42.L, H Q Xiao, H B Zheng. (2013) . Mental Health of Graduating Class Teachers of Primary and Secondary Schools in Luoding City.China Journal of Health Psychology 10-123.
- 43.Beer J, Beer J. (1992) . Burnout and Stress, Depression and Self-Esteem of Teachers.Psychological Reports,71(3) 1331-1336.
- 44.Y L Zhao, X L Yang. (2015) Mental health of primary and secondary school teacher during 1991-2010.Chinese. , Journal of School 36(4).
- 45.Kyriacou C. (2001) Teacher Stress: Directions for future research.Educational. , Review 53(1), 27-35.
- 46.D P Ngidi, P T Sibaya. (2002) . , Black Teachers’ Personality Dimensions and Work-Related Stress Factors.South African Journal of Psychology 32(3), 7-15.
- 47.Montgomery C, A. (2005) A Meta-Analysis for Exploring the Diverse Causes and Effects of Stress in. , Teachers.Canadian Journal of Education / Revue Canadienne del’éducation 28(3), 458-10.
- 48.Li P, Z C, Yang Y, J Q Yang, H Y Li. (2022) . The Relationship Between Job Stress and Job Burnout in Primary and Middle School Teachers: A Chain Mediating Effect of Emotional Labor and Job Satisfaction.Studies of Psychology and Behavior,20(3) 412-418.
- 50.X D Wang, X L Wang, Ma H. (1999) . Handbook of mental health assessment scale.Chinese Mental Health Journal,5 468-471.
- 51.Epskamp S, E I Fried. (2018) A tutorial on regularized partial correlation networks.Psychological. , Methods 23(4), 617-634.
- 52.Epskamp S, Cramer A O J, L J Waldorp, V D Schmittmann, Borsboom D et al. (2012) qgraph:. Network Visualizations of Relationships in Psychometric Data.Journal of Statistical Software,48(4) 1-18.
- 53.Epskamp S, Borsboom D, E I Fried. (2018) Estimating psychological networks and their accuracy: A tutorial paper.Behavior. , Research 50(1), 10-3758.
- 54.S Q Chen, K W Bi, S B Lyu, Sun P, G A Bonanno. (2022) Depression and PTSD in the aftermath of strict COVID-19 lockdowns: a cross-sectional and longitudinal network analysis.European. , Journal 13(2), 2115635-10.
- 55.Z H Wei, Ren L, Yang L, Liu C, Cao M et al. (2021) The relationship between social anxiety and felt stigma in patients with epilepsy: A network analysis.Seizure-European. , Journal of Epilepsy,92 76-81.
- 56.Haslbeck J M B, L J Waldorp. (2020) mgm: Estimating Time-Varying Mixed Graphical Models. in High-Dimensional Data.Journal of Statistical Software,93(8) 46-10.
- 57.Moffa G, Catone G, Kuipers J, Kuipers E, Freeman D et al. (2017) Using Directed Acyclic Graphs. in Epidemiological Research in Psychosis: An Analysis of the Role of Bullying in Psychosis.Schizophrenia Bulletin,43(6) 1273-1279.
- 58.Scutari M. (2010) Learning Bayesian Networks with the bnlearn. , R Package.Journal of Statistical 35(3), 1-22.
- 59.Scutari M, Nagarajan R. (2013) Identifying significant edges in graphical models of molecular networks.Artificial. , Intelligence in 57(3), 207-217.
- 60.R J McNally, D J Robinaugh, Deckersbach T, L G Sylvia, A. (2022) Estimating the Symptom Structure of Bipolar Disorder via Network Analysis: Energy Dysregulation as a Central Symptom.Journal of Psychopathology and Clinical Science,131(1). 86-97.
- 61.Borkulo C D Van, R Van Bork, Boschloo L, J, Tio P et al. (2022) Comparing Network Structures on Three Aspects: A Permutation Test.Psychological Methods. 14, 10-1037.
- 62.H B, E A Garcia. (2009) . Learning from Imbalanced Data [Review].IeeeTransactions on Knowledge and Data Engineering,21(9) 1263-1284.
- 63.Sartorius N, Jablensky A, Gulbinat W, Ernberg G. (1980) WHO collaborative study: assessment of depressive disorders.Psychological. 10(4), 743-749.
- 64.Zahn R, K E Lythe, J A Gethin, Green S, Deakin J F W et al. (2015) The role of self-blame and worthlessness in the psychopathology of major depressive disorder.Journal of Affective Disorders,186. 337-341.
- 65.Leong F T L, J L Huang, Mak S. (2014) . Protestant Work Ethic, Confucian Values, and Work-Related Attitudes in Singapore.Journal of Career Assessment,22(2) 304-316.
- 66.X J Lyu. (2020) Work Engagement in the Context of Confucian Culture: A Case. of Chinese Civil Servants.Frontiers in Psychology,11, 573146.doi: 10-3389.
- 67.X S Zhu, G X Tian, H B Yin, W J He. (2021) Is Familism a Motivator or Stressor? Relationships Between Confucian Familism, Emotional Labor, Work-Family Conflict, and Emotional Exhaustion Among Chinese Teachers.Frontiers in Psychology,12, 766047.doi:. 10-3389.
- 68.Agyapong B, Obuobi-Donkor G, Burback L, Wei Y. (2022) Stress, Burnout, Anxiety and Depression among Teachers: A Scoping Review.International. , Journal of Environmental Research 10706-10.
- 69.He L, Huang L, Huang Y, Li H, Zhang Z et al. (2025) Prevalence and influencing factors of anxiety, depression, and burnout among teachers in China: a cross-sectional study.Frontiers in. , Psychiatry 16, 1567553-10.
- 70.Zhong Y, Lai S, Li Y, Yang K, Tang H et al. (2025) Burnout and its relationship with depressive symptoms in primary school teachers under the "Double Reduction" policy in China. Frontiers. in Public Health 12, 1420452-10.
- 71.P J Jones, Mair P, B C Riemann, B L Mugno, R J McNally. (2018) A network perspective on comorbid depression in adolescents with obsessive-compulsive disorder.Journal of Anxiety Disorders,53. 1-8.
- 72.M C, Marchetti I, C G Beevers. (2019) Using Network Analysis to Identify Central. Symptoms of Adolescent Depression.Journal of Clinical Child and Adolescent Psychology,48(4) 656-668.
- 73.A R Wasil, K E Venturo-Conerly, Shinde S, Patel V, P J Jones. (2020) network analysis to understand depression and substance use in Indian adolescents.Journal of Affective Disorders,265. 278-286.
- 74.J C Nwoko, T I Emeto, Malau-Aduli A E O, B S Malau-Aduli. (2023) . , A Systematic Review of the Factors That Influence Teachers’ Occupational Wellbeing.International Journal of Environmental Research 6070-10.
- 75.Zhong S, Hu J, Xu H. (2025) The impact of family support on depression among primary and secondary school teachers in China: the serial mediating roles of subjective time pressure and work-family conflict. , BMC Psychology 13(1), 1280-10.
- 76.Song H, Hao B, Yu X. (2021) Unreasonable burden performance, adverse effects and coping strategies of primary and secondary school teachers based on a survey in. , Beijing.Educational Science Research 10, 70-76.
- 77.Baeriswyl S, Bratoljic C, Krause A. (2021) How homeroom teachers cope with high demands: Effect of prolonging working hours on emotional exhaustion. , Journal of School Psychology 85, 125-139.
- 78.Kuehner C, Huffziger S. (2012) Response styles to depressed mood affect the long-term course of psychosocial functioning in depressed patients.Journal of Affective Disorders,136(3). 627-633.
- 79.Bondolfi G, Jermann F, Linden M Van der, Gex-Fabry M, Bizzini L et al. (2010) Depression relapse prophylaxis with Mindfulness-Based Cognitive Therapy: replication and extension in the Swiss health care system.Journal of Affective Disorders,122(3). 224-231.
- 80.G X Tian, Y J Zeng. (2021) . Emotional Confusion of Primary and Secondary School Teachers— An Investigation of Educational Ethongraphy from the Perspective of Emotional Labor.Teacher Education Research,33(4) 68-75.
- 81.J M Diefendorff, M H Croyle, R H Gosserand. (2005) The dimensionality and antecedents of emotional labor strategies.Journal of Vocational Behavior,66(2). 339-357.
- 82.Hargreaves A. (1998) The emotional practice of teaching.Teaching and Teacher. Education,14 835-854.
- 83.S E Hobfoll. (1989) Conservation of resources. A new attempt at conceptualizing stress.Am Psychol,44(3). 513-524.
- 84.L S Goldberg, A. (2007) Display rules versus display autonomy: Emotion regulation, emotional exhaustion, and task performance in a call center simulation.Journal of Occupational Health Psychology,12(3). 301-318.
- 85.Yagil D, Luria G, Gal I. (2008) Stressors and resources in customer service roles Exploring the relationship between core self-evaluations and burnout.International. , Journal of Service Industry 19(5), 575-595.
- 86.Jiao Y, Cheng R. (2008) On the lax professional morale among higher educational institution teachers.Journal of. , Lanzhou University(Social 36(6), 149-152.
- 87.Ciciolla L, S. (2019) Invisible Household Labor and Ramifications forAdjustment: Mothers as Captains of Households.Sex Roles,81(7-8). 467-486.
- 88.Soini T, Pyhältö K, Pietarinen J. (2010) Pedagogical well-being: reflecting learning and well-being in teachers' work.Teachers and Teaching,16(6). 735-751.
- 89.C van Borkulo, Boschloo L, Borsboom D, Penninx B, L J Waldorp et al. (2015) . Association of Symptom Network Structure With the Course of Longitudinal Depression.JAMA Psychiatry,72(12) 1219-1226.
- 90.P K Schraedley, I H Gotlib, Hayward C. (1999) Gender differences in correlates of depressive symptoms in adolescents.Journal of Adolescent Health,25(2). 98-108.
- 91.Demir Göloğlu, C, Kızılhan P. (2021) The examination of the relationship between teachers’ commitment to the curriculum and teacher autonomy behaviors.Psycho-Educational Research Reviews. 10(3), 221-238.
- 92.Luo Yun, Deng Yuting, Zhang Hui. (2020) The influences of parental emotional warmth on the association between perceived teacher–student relationships and academic stress among middle school students in China.Children and Youth Services Review. 114, 105014-10.
- 93.T Z Ngwenya, Huang N, I A Wang, C Y. (2022) . Urban-Rural Differences in Depression Literacy Among High School Teachers in the Kingdom of Eswatini.Journal of School Health,92(6) 561-569.
- 94.Guerrero E, Gómez R, J M Moreno, García-Baamonde E, Blázquez M. (2011) Burnout syndrome, ways of coping and mental health in non-university teachers.Behavioral. 19(3), 557-576.
- 95.P A Lizana, Lera L. (2022) . Depression, Anxiety, and Stress among Teachers during the Second COVID-19 Wave.International Journal of Environmental Research and Public Health,19(10), 5968.doi: 10-3390.
- 96.S A, F R Rasul, Head J, Singleton N. (2011) . Occupation and mental health in a national UK survey.Social Psychiatry and Psychiatric Epidemiology,46(2) 101-110.
- 97.Ghasemi F. (2022) . (Dys)functional Cognitive-Behavioral Coping Strategies of Teachers to Cope with Stress, Anxiety, and Depression.Deviant Behavior,43(12) 1558-1571.
- 98.Y L Deng, S Q Gao, J Y Wang, B L Li. (2023) . The Relationship between Work-family Conflict and Depression in Primary and Middle School Teachers during COVID-19: A Moderated Mediation Model.Psychological Development and Education,3(1) 121-131.
- 99.Yang R, Q L Wang, He P, N H Xiang, X T Deng et al. (2021) Relationship between perception of stress, depression and anxiety in primary and secondary school teachers: The mediating role of coping.China. , Journal of Health 29(12), 1842-1848.
- 100.A M Hayes, Yasinski C, Barnes Ben, J, Bockting C L H. (2015) Network destabilization and transition in depression: New methods for studying the dynamics of therapeutic change.Clinical Psychology Review,41. 27-39.
- 101.C A Levinson, Zerwas S, Calebs B, Forbush K, Kordy H et al. (2017) The Core Symptoms of Bulimia Nervosa, Anxiety, and Depression: A Network Analysis. , Journal of Abnormal Psychology 126(3), 340-354.
- 102.D J Robinaugh, A J Millner, R J McNally. (2016) Identifying Highly Influential Nodes in the Complicated Grief Network. , Journal of Abnormal Psychology 125(6), 747-757.