Investigations of Molecular Evolutionary Mechanisms in Partially Sequenced Heat Shock Protein70 Homologue-Coding Gene of Olive Leaf Yellowing-Associated Virus Isolates from Tunisia
Abstract
Reverse Transcription Polymerase Chain Reaction (RT-PCR) using new designed primers pair for Heat Shock Protein70 homologue (HSP70h) of Olive leaf yellowing-associated virus revealed 667 amplified product of 10 olive accessions collected from various olive-growing regions in Tunisia. Amplicons were cloned and sequenced. The sequences were deposited in the international databases. Pairwise sequence comparisons among 10 Tunisian isolates along with a reference sequence (AJ440010) extracted from GenBank revealed a nucleotide identity of 86.06-99.40 and an amino acid similarity of 91.89-99.55. Sequence multiple alignments were searched for evidence of recombination using three methods, ie. Differences of Sums of Squares (DSS) implemented in TOPALi v2.5 software and Single Breakpoint (SBP) along with GARD, a genetic algorithm, both incorporated in HyPhy package. All used methods pointed out the presence of putative breaking points in partially sequenced HSP70h-coding gene. Since failing to account for recombination can mislead the phylogeny inference and can elevate the false positive error rate in positive selection assessment, the use of GARD resulted in the reconstruction of different phylogenies on the left as well as on the right sides of putative recombination breaking points, and the 11 accessions were distributed into at least three clusters compared to MEGA6 software which delineated only two clades. Nonetheless, by dividing the aligned sequences at breakpoints into separate sequence sets, MEGA6 delineated a clustering pattern different from the former two. As a result, recombination reshuffled the affiliation of the different accessions to the clusters. Analysis of selection pressures exerted on HSP70h encoded protein using different models (SLAC, IFEL, FEL, REL, PARRIS, FUBAR, MEME, GA Branch, and PRIME) taking into account recombination, and implemented in HyPhy package, revealed that it underwent predominantly purifying selection as confirmed by Tajima’s D, Fu and Li’s D and F tests, and SNAP algorithm. However, a few sites were also under positive selection as assessed by various models such as FEL, IFEL, REL, MEME, and PRIME.
Author Contributions
Academic Editor: wentao xu, food safety and molecular biology
Checked for plagiarism: Yes
Review by: Single-blind
Copyright © 2016 Moncef BOULILA, et al.
 This is an open-access article distributed under the terms of the Creative Commons Attribution License, which permits unrestricted use, distribution, and reproduction in any medium, provided the original author and source are credited.
Competing interests
The authors have declared that no competing interests exist.
Citation:
Introduction
Viruses represent an important threat to plant production worldwide. In spite of numerous efforts for their elimination, the number of these viruses is still noticeably limited. Their eradication is being counterbalanced by emergence of new viruses which induce severe economic losses. These emerging plant viruses highlight the importance of studies of plant virus evolution. Much of adaptive potential of viruses stems from their large population sizes, and their high degrees of variability. The use of error-prone RNA polymerase during replication by RNA viruses is the primary driver of high mutation rates. Arising mutations can become fixed within virus populations, and are subject to the effects of processes such as natural selection. Selection is a directional process by which the frequencies of variants that are the fittest in a given environment will increase in the population (positive selection) whereas those of less fit variants will decrease (negative selection). At the molecular level, selection detection relies on comparisons of the relative numbers of non-synonymous and synonymous substitutions. Silent substitutions, resulting in no change in the amino acid encoded by the codon, are assumed to arise via neutral mutations and are not under selection 1. However, replaced substitutions that lead to resultant changes in amino acids can often affect tertiary structure and function, and are typically either under positive (adaptive) or negative (purifying) selection. Non-synonymous substitutions will be mildly deleterious and will typically be removed from populations under negative selection unless they directly impose some fitness advantage 1. The ratio of dN/dS(rate of non-synonymous substitutions per non-synonymous site/ rate of synonymous substitutions per synonymous site) can suggest whether a gene has had a variable rate of non-synonymous changes than would be expected from random neutrality and is potentially undergoing positive or negative selection for amino acid changes in that region. Thus, the value of dN/dS more than 1 suggests that the gene is under positive selection. A value close to 1 suggests that a gene is under neutral selection and is experienced neutral evolution. However, a value of less than 1 indicates that a gene is under the influence of negative or purifying selection. Recombination is another driving force of plant RNA virus evolution. In addition to increasing sequence variability, RNA recombination can be an efficient tool for viruses to repair viral genome, thus contributing to viral fitness 2, 3, 4, 5, 6, 7. It may also play a role in the formation of subviral RNAs that include defecting interfering (DI) RNAs associated with many plant viruses, i.e. some members of the Tombusviridae8. DI-RNAs are mainly derived from the parent (helper) virus via sequence deletion. The ease of their genetic manipulation has resulted in rapid discoveries on cis-acting RNA replication elements required for replication and recombination 4. Additionally, these DI-RNAs played a major role in post-transcriptional gene silencing (PTGS). They could trigger potent gene silencing response against the helper virus without hurting themselves from the same response 9.
Olive is one of the most widely grown fruit tree in Tunisia. It plays a major social, economical and cultural role. Olive trees cover an estimated area of 1.7 million hectares out of which 20,000 are irrigated. El Air et al. 10 stated that eight viruses were detected from Tunisian olive groves, i.e. Arabis mosaic virus (ArMV), Strawberry latent ringspot virus (SLRSV), Cherry leaf roll virus (CLRV), Cucumber mosaic virus (CMV), Olive latent virus 1, Olive latent virus 2, Olive latent ringspot virus (OLRSV), and Olive leaf yellowing-associated virus (OLYaV). The latter has been ascertained in olive trees from 18 different countries 11. In addition, according to this author, OLYaV is a member of the so-called «leaf yellowing complex» on olive. It appears to have a detrimental impact on the yield and growth rate 12. However, OLYaV has been also reported that it was found in symptomless trees in numerous countries 11. OLYaV is currently a member of the family Closteroviridae 13; but it is not allocated to any of the genera composing this family because more biological and molecular data are likely to be needed for unequivocal classification. This virus has a monopartite positive-sense single-stranded RNA. Only part of the viral genome, comprising 4,605 nucleotides from ORFs 1b (RdRp), 2(21kDa), 3(7kDa), 4(HSP70h), and the 5’ end of ORF 5 (HSP90h) has been sequenced 13, 14. These sequences have been deposited in GenBank under the accession number AJ440010. Later, genome sequencing has been extended towards the 3’ terminus of ORF 5 (HSP90h) giving rise to a segment having a size of 854 nucleotides 15. This RNA is protected by a coat protein having a molecular weight of 24 kDa. No seed and vector transmission are recorded so far 11.
In spite of widely provided efforts to characterize OLYaV at molecular level, studies about molecular evolution of this virus are nowadays still lacking. The objective of this work was to give a preliminary idea on evolutionary strategies employed by this virus to survive by searching for the occurrence of potential recombination events and evaluate selection pressure exerted on amino acids even though using a limited genomic region of OLYaV (partial sequences of HSP70h-coding gene).
Material and Methods
Source of Material
Shoot samples from 37 cultivars showing yellowing symptoms on leaves were collected from two mother block stands Institut de l’Olivier of Sfax (southern Tunisia) and Gatrania (central Tunisia), and from a nursery Nour located at Karma (central Tunisia).
Oligonucleotide Primers
Newly designed specific primers by using Primer3 software 16, were used for molecular studies of HSP70h-coding gene, and having the following sequences: sense primer: 5’-ATC ATG AAC GAG CCT TCA GC-3’ ; antisense primer : 5’-CGG CAG CGA CTA TAA TAC GA-3’. These primers should be amplifying a DNA copy of 667 base pairs. The virus sense and antisense primers correspond to nucleotides (nt) positions 2618-2637, and 3265-3284, respectively, of the sequence submitted to GenBank (AJ440010) by Saponari et al. 14.
Viral target RNA Preparation and RT-PCR Amplification
Phloem tissue, scraped from 12 shoots (two-year old) per tree collected in spring of 2013, was powdered in liquid nitrogen. Then, 100 mg of each sample was used for total RNA extraction using PureLink RNA™ Mini Kit (Life technologies, Carlsbad, CA-USA) according to the manufacturer’s protocol. RNA was finally eluted with 50 µl of RNase/DNase-free distilled water.
cDNA Synthesis, PCR Amplification, Cloning and Sequencing
Purified total RNA (5µl) were mixed with 1 µl random hexamer primer (Bioron GmbH, Ludwigshafen, Germany) (0.5 µg.µl-1), 1 µl 10 mM dNTP mix (10 mM each dATP, dCTP, dGTP, dTTP at neutral pH), and 13 µl RNase/DNase-free distilled water. The reaction mixture was incubated at 65°C for 5 min and chilled on ice for 5 min. After a brief centrifugation, a second reaction mixture containing 6 µl 5X First-Strand Buffer [250 mM Tris-HCl (8.3 at room temperature), 375 mM KCl, 15 mM MgCl2], 3 µl 0.1M DTT, and 1 µl RNaseOUT™ (40 U.µ-1) (Life technologies, Carlsbad, CA-USA), was added to the former. The reaction mixture was incubated at 37°C for 2 min and chilled on ice for 5 min. A third mixture containing 1 µl M-MLV (200 U.µl-1) (Life technologies, Carlsbad, CA-USA), 3 µl 10 mM dNTP mix, 4 µl 5X First-Strand Buffer, and 12 µl RNase/DNase-free distilled water, was added to the former two. The reaction mixture was incubated successively at 25°C for 10 min, 37°C for 50 min, and 70°C for 15 min. Incubation was done in a thermal cycler (Multigene optimax, Labnet, Edison, USA).
The PCR reaction mixture using the newly designed specific primer was prepared by using 5 µl of the resulting cDNA. The OLYaV cDNA was transferred to a tube containing 5 µl 10X PCR buffer minus Mg++ 200 mM Tris, 2 µl 10 mM dNTPs, 3 µl 50 mM MgCl2, 15 pmol of each forward and reverse primers, 2 U Taq DNA polymerase (5 U.µ-1) (Life technologies, Carlsbad, CA-USA). Finally, RNase/DNase-free water was added to 45 µl. The amplification proceeded in the thermocycler (Multigene optimax, Labnet, Edison, USA) at 94°C for 5 min, and through 35 cycles of 94°C for 30 s, 53°C for 30 s, and 72°C for 45 s, with a final step at 72°C for 10 min. Amplification products were analyzed by electrophoresis of 10 ml aliquots on 1.5% agarose gel, in 1X Tris-Borate-EDTA buffer 17. Bands were visualized by ethidium bromide staining (5 mg.ml-1) and photographed using a U.V. transilluminator (ETX 20.M) at a wavelength of 312 nm and a Vilber Lourmat photo-print system (Model DP-001.FDC).
Amplicons of successfully amplified isolates were cloned into pCR2.1 vector using a TOPO TA cloning kit (Life technologies, Carlsbad, CA-USA) and used to transform DH5α cells of Escherichia coli following manufacturer’s instructions. Recombinant clones were screened for the presence of inserts of the expected size by colony PCR using M13F and M13R primers. Plasmid DNA was purified from positive recombinant clones using the Wizard minipreps DNA purification system (Promega corporation MD). Three clones for each positive isolate were sequenced in both orientations based on dideoxy chain termination method 18 using the Big Dye Terminator Ready Reaction mix provided by Life technologies (Carlsbad, CA-USA) in an automated sequencer (ABI PRISM 377). When necessary, additional clones were sequenced to resolve ambiguities in amplicon sequences. Contigs were assembled using CAP3 program 19. Sequence analysis was performed using BioEdit program.
Alignment of Sequences and Construction of Phylogenetic Trees
Databank searches for homologies to OLYaV were performed using the FASTA 20 and WU-BLAST 2, based on the Basic Local Alignment Search Tool algorithm 21, 22 programs.
The nucleotide sequences of PCR products along with the reference sequence AJ440010 were aligned using CLUSTALW 2.1, CLUSTALX 2.1 23 and Multalin 24 softwares with default settings. The phylogenetic relationships among OLYaV isolates were determined with the Maximum Likelihood (ML) algorithm incorporated in the MEGA version 6 program 25. Based on the evaluation of best fit substitution model executed in MEGA6, the ML tree was reconstructed under the assumption of substitution model T92 coupled to a discrete Gamma distribution (+G) with five rate categories 26. The substitution model parameters estimated were (i) base frequencies: f(A) = f(T) = f(C) = f(G) = 0.218, (ii) substitution rates: r(AT)= r(CA) = r(GT) = r(GT) = r(TA) = 0.017; r(AC) = r(TG) = r(CG) = r(GC) = 0.013; r(AG) = r(TC) = 0.191; r(CT) = r(GA) = 0.247, and (iii) transition/transversion ratios: R = 6.98. The Bayesian Information Criterion value (BIC = 4458.524) with T92+G (+G = 0.33) model was the lowest among the 24 models tested.
Recombination Analyses
Occurrence of potential recombination events between nucleotide sequences was explored with SBP (Single breakpoint), GARD 27, 28 and TOPALi v.2.5 29. SBP and GARD are two algorithms for recombination detection use a statistical approach to search recombination breakpoints from multiple-sequence alignments of homologous sequences. Potential breakpoints are identified by improvement of the small-sample corrected Akaike information criterion (cAIC) 30 for phylogenetic trees constructed of individual recombinant fragments. Based on the outcome of the analysis, a level of support is assigned and expressed as a breakpoint placements score 27, 28. Breakpoints identified by GARD were then assessed for significance using the KH test 31 of the HyPhy package 32. TOPALi v.2.5 implements DSS (Differences of Sums of Squares) statistics. This method uses a sliding window and considers changes in the branching patterns of the trees estimated on the windows along the alignment, corresponding to high values of DSS.
RNA Polymorphism and Evolution
DnaSPversion 5.10.01 33 was used to estimate Tajima’s D34 and Fu and Li’s D and F35 statistical tests to examine the hypothesis of neutrality operating on the OLYaV (partial HSP70h gene) sequences. An estimation of several population genetic parameters including nucleotide polymorphism (П estimated by the average number of nucleotide differences between two random sequences in a population), haplotype diversity (Hd, the frequency and number of haplotypes in a population), the statistic θfrom the number of segregationsites (S) 36, the average rate of synonymous and non-synonymous substitutions, ΔHd (the variance of haplotype diversity), K (average of number of pairwise nucleotide differences), was done. The distribution ofdS and dN along the coding regions was analyzed using the SNAP program (http://www.hiv.lanl.gov; 37). Based on the results obtained by the statistical tests mentioned above, examination for selection was performed using codon-based Maximum Likelihood methods i.e., the Single-Likelihood Ancestor Counting (SLAC), Fixed Effects Likelihood (FEL), Internal Fixed Effects Likelihood (IFEL), Random Effects Likelihood (REL) 38, Mixed Effects Model of Episodic Selection (MEME) 39, and Fast Unbiased Bayesian Approximation (FUBAR) models 40 and the Partitioning Approach for Robust Inference of Selection (PARRIS) 41 implemented at http://www.datamonkey.org, the web server of HyPhy package 42. To further investigate when and how selection pressure varied over the evolutionary history, GA-Branch (Genetic Algorithm-Branch) method 43, was applied. The GA-Branch program utilizes a genetic algorithm to test an extensive number of models of codon evolution based on small sample AIC score. This analysis is able to classify each branch to a specific dN/dS rate class. Furthermore, PRIME (Property Informed Model of Evolution) determined which biochemical properties could drive substitutions at a given site; e.g. if a site is positively selected, then which properties are being selected for/against. The exchangeability function is a product of property-specific contributions. PRIME is a model which involves a parameter α which represents the importance of property. Positive value (p<0.05) of α cause the property to be conserved (purifying selection) whereas a negative value (p<0.05) means that the property tends to changing (positive selection). In case of α = 0, selection is neutral with respect to that property. PRIME currently supports two predefined sets of five amino acid properties: the properties used by Conant et al. 44 (α1, chemical composition; α2, polarity; α3, volume; α4, iso-electric point; α5, hydropathy), and Atchley et al. 45 (α1, polarity index; α2, secondary structure factor; α3, volume; α4, refractivity/heat capacity; α5, charge/iso-electric point).
Results
OLYaV PCR Products and Submission of Sequences to GenBank
RT-PCR successfully amplified the targeted genome portion of 10 out of the 37 collected accessions. The size amplicon obtained (Figure 1) was as expected, i.e. 667 pb, and as shown in the revealed sequences (Figure 2). The sequences of 10 accessions were deposited in the international databases under the accession numbers: KP143750 (Meski G.TN), KP143751 (Frenjiventu G.TN), KP143752 (Chetoui G.TN), KP143753 (Ascolana G.TN), KP143754 (Chetoui N.TN), KP143755 (Sahli N.TN), KP143756 (Meski N.TN), KP143757 (Meski I.O.S.TN), KP143758 (Zarrazi I.O.S.TN), and KP143759 (Chemlali I.O.S.TN).
Figure 1.Agarose gel of HSP70h PCR products. M Marker (100 bp ladder), lane 0 negative control, lane 1 positive control, lane 2 KP243751, lane 3 KP243759, lane 4 KP243752, lane 5 KP243754. Bands correspond to amplicons having a size of 667 bp.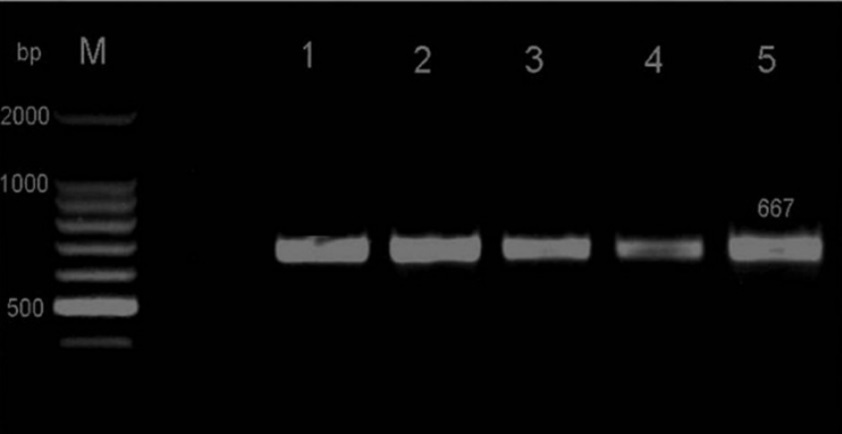
Figure 2.Nucleotide sequence alignment of HSP70h partial gene of 10 accessions of Olive leaf yellowing-associated virus collected in Tunisia along with the reference sequence AJ440010 performed by using MultAlin program. Dots indicate identical residue.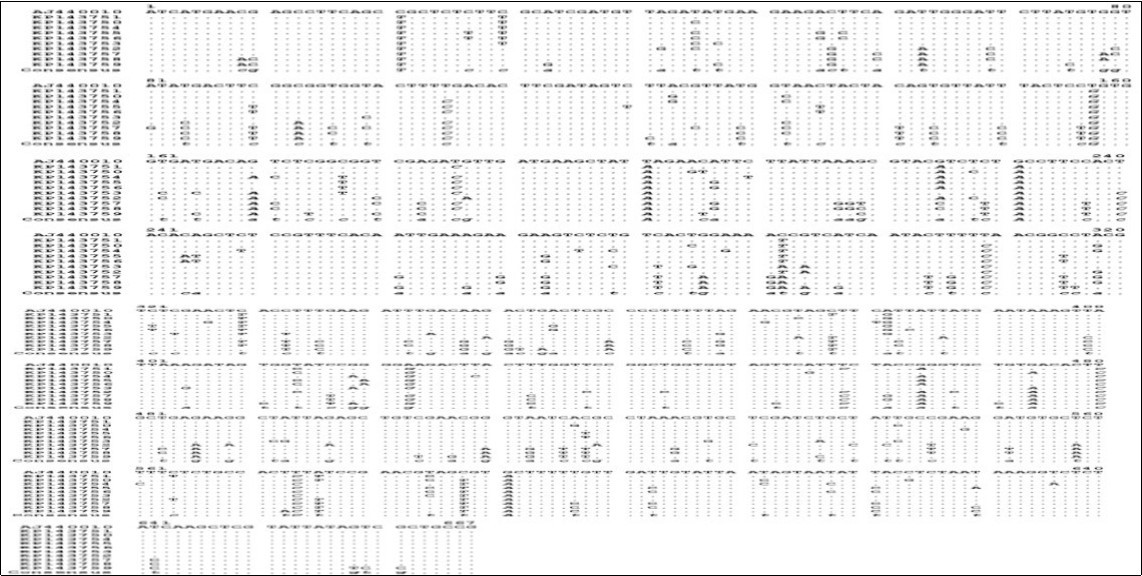
Sequence Identity/Similarity Comparison and Maximum Likelihood Estimate of Substitution Matrix and Transition/Transversion Bias
The sequences of the amplicons obtained from the isolate genome candidates as well as the sequence reference AJ440010 were aligned and showed a divergence of sequences ranging roughly from 86.06 to 99.40, and from 91.89 to 99.55 for the nucleotide and amino acid residues, respectively (Table 1). Nucleotide substitution patterns and rates of partial HSP70h sequences were estimated using the model T92. A discrete gamma distribution was used to model evolutionary rate differences among sites (5 categories +G, parameter = 0.3744). Thus, the general model formula was T92+G. Rates of different transitional and tranversional substitutions were determined and shown in Table 2. The estimated Transition/Transversion bias (R) was 7.14. A total of 667 positions were identified in the final dataset. Codon positions included were first + second + third + non-coding. All positions containing gaps and missing data were eliminated from the dataset (complete deletion option) before analysis with the MEGA6 program.
Table 1. Nucleotide sequence identity (lower diagonal) and amino acid sequence similarity (upper diagonal) of the HSP70h partial gene of 11 isolates of OLYaV. Values in bold indicate lowest and highest percentages of divergence.| KP143750 | KP143751 | KP143752 | KP143753 | KP143754 | KP143755 | KP143756 | KP143757 | KP143758 | KP143759 | AJ440010 | |
| KP143750 | 99.10 | 95.05 | 96.85 | 98.20 | 96.85 | 97.30 | 95.05 | 95.05 | 93.24 | 97.75 | |
| KP143751 | 96.70 | 95.95 | 97.75 | 99.10 | 97.30 | 97.75 | 95.50 | 95.50 | 93.24 | 98.65 | |
| KP143752 | 92.80 | 93.55 | 94.59 | 95.95 | 93.69 | 94.14 | 95.50 | 94.59 | 92.79 | 95.50 | |
| KP143753 | 94.45 | 94.90 | 90.85 | 98.65 | 95.05 | 95.50 | 95.05 | 95.05 | 94.59 | 96.85 | |
| KP143754 | 94.90 | 95.50 | 91.15 | 93.70 | 96.40 | 96.85 | 95.50 | 95.50 | 94.14 | 97.75 | |
| KP143755 | 94.45 | 95.95 | 90.70 | 93.25 | 93.85 | 99.55 | 94.14 | 94.14 | 91.89 | 95.95 | |
| KP143756 | 94.45 | 95.95 | 90.70 | 93.25 | 94.15 | 99.40 | 94.59 | 94.59 | 92.34 | 96.40 | |
| KP143757 | 86.81 | 88.31 | 88.46 | 86.96 | 86.81 | 87.56 | 87.56 | 98.20 | 95.05 | 95.05 | |
| KP143758 | 87.26 | 88.76 | 88.31 | 87.11 | 87.26 | 88.16 | 88.01 | 98.50 | 96.85 | 95.05 | |
| KP143759 | 86.06 | 87.56 | 87.11 | 87.11 | 85.46 | 86.36 | 86.21 | 91.75 | 92.65 | 93.24 | |
| AJ440010 | 95.05 | 96.85 | 92.20 | 94.00 | 94.15 | 94.00 | 94.00 | 86.96 | 87.41 | 86.96 |
| A | T/U | C | G | |
| A | - | 2.01 | 1.38 | 13.94 |
| T/U | 1.58 | - | 23.44 | 1.39 |
| C | 1.58 | 34.07 | - | 1.39 |
| G | 15.82 | 2.01 | 1.38 | - |
Inference about Recombination, Selection and Phylogeny
To detect potential recombination breakpoint in aligned sequences of 11 accessions, three methods were used: DSS (Differences of Sums of Squares) implementend in TOPALi v2.5, Single-Breakpoint (SBP) and the genetic algorithm GARD incorporated in HyPhy package. DSS statistics (window size: 500, step size: 10) revealed a major peak strongly supporting the presence of recombination signal in aligned sequences having the position 380 (Figure 3). Similarly, SBP algorithm revealed a breakpoint in the position 369 supported by a corrected Akaike Information Criterion (cAIC) having the value 29.9312, and a model averaged support of 100%. In contrast, GARD placed breakpoints at bp 99, 375, and 585 in aligned sequences of 667 bp segment based on cAIC goodness of fit. These breaking points corresponded to positions 2716, 2992, and 3202 in the entire HSP70h-coding gene of the reference sequence AJ440010, respectively.
Figure 3.Graph displaying potential breakpoint of recombination represented by a peak calculated by Differences of Sums of Squares (DSS) statistics.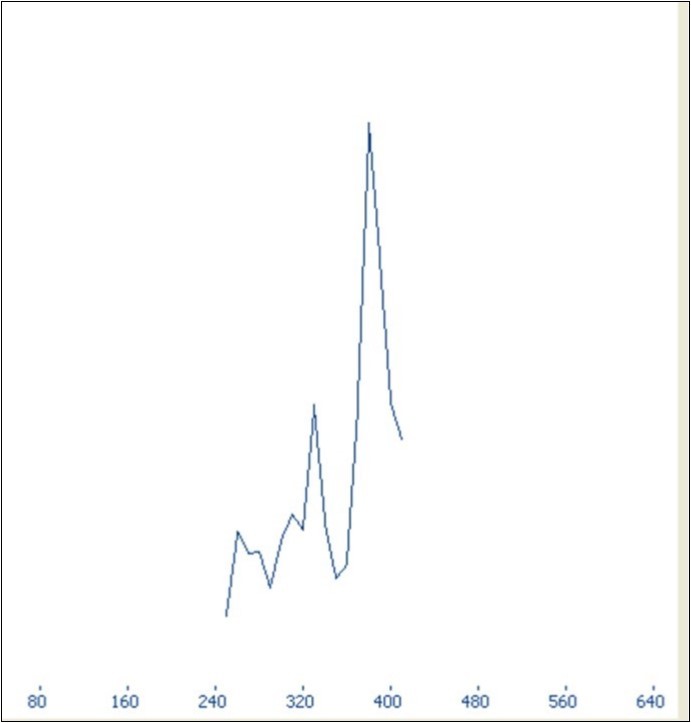
On phylogeny, using MEGA6 which did not take into account the presence of recombination signals when reconstructing trees, inferred isolates split into two major groups. While the former encompassed the accessions KP143750, KP143751, KP143752, KP143753, KP143754, KP143755, KP143756, and AJ440010, the latter comprised the accessions KP143757, KP143758, and KP173759 (Figure 4a). Since several putative recombination events were detected, a single phylogeny may no longer accurately describe evolution of OLYaV isolates as shown in Figure 4a, where only two distinct majorgroups were delineated. Different phylogenies may therefore be required to describe the evolutionary relationships of the segments defined by recombination breakpoints. Thus, aligned sequences were divided at breakpoints into separate sequence sets and different trees were reconstructed using MEGA6 software. It was shown that the clustering pattern was heterogeneous. In fact, whereas the reconstructed trees of the segments 1-99 bp, and 586-667 bp segregated into five (Figure 4b), and four (Figure 4c) clusters, those of the segments 100-375 bp (Figure 4d), and 376-585 bp (Figure 4e) were identical to the tree reconstructed without taking into account recombination (Figure 4a) and thereby representing 72% of the whole partially sequenced HSP70h gene. In HyPhy, application of the test of Kishino-Hazegawa (KH) resulted in the identification of a non significant topological incongruence at p = 0.1 around breaking point 99 (Figure 5a, Figure 5b), thus suggesting a priori that other processes (e.g. substitution rate heterogeneity in the HSP70h gene) may be contributing to phylogenetic variation before and after the breakpoint (Table 3). In contrast, application of the test of Khishino-Hazegawa (KH) resulted in the iden0tification of a significant topological incongruence at p = 0.1 around breaking point 375 and at p = 0.05 around breakpoint 585 bp in aligned sequences of HSP70h gene fragment (Table 3) as clearly evidenced by GARD plots (Figure 6). GARD reconstructed trees were discordant based on the gene sequence on the right and left sides of the identified breakpoints (Figure 5b,Figure 5c,Figure 5d). Thus, GARD evidenced that the 11 isolates of OLYaV were distributed into at least three distinct groups but, clearly, group content varied according to gene sequence fragment. For example in Figure 5b, KP143752 accession constituted a distinct cluster; in contrast, this accession is no more constituting a distinct clade as shown in Figure 5c and thereby was included in group I composed by the accessions KP143751, KP143752, KP143754, KP143755, KP143756, KP143757, KP143758, KP143759, and AJ440010; thus suggesting a rearrangement operated under the influence of recombination events.
Figure 4.Radial representation of the phylogenetic relationship among 11 isolates of OLYaV based on the nucleotide sequence of the entire segment of HSP70h partial gene (a) and of divided segments at breakpoints, i.e. segments 1-99 bp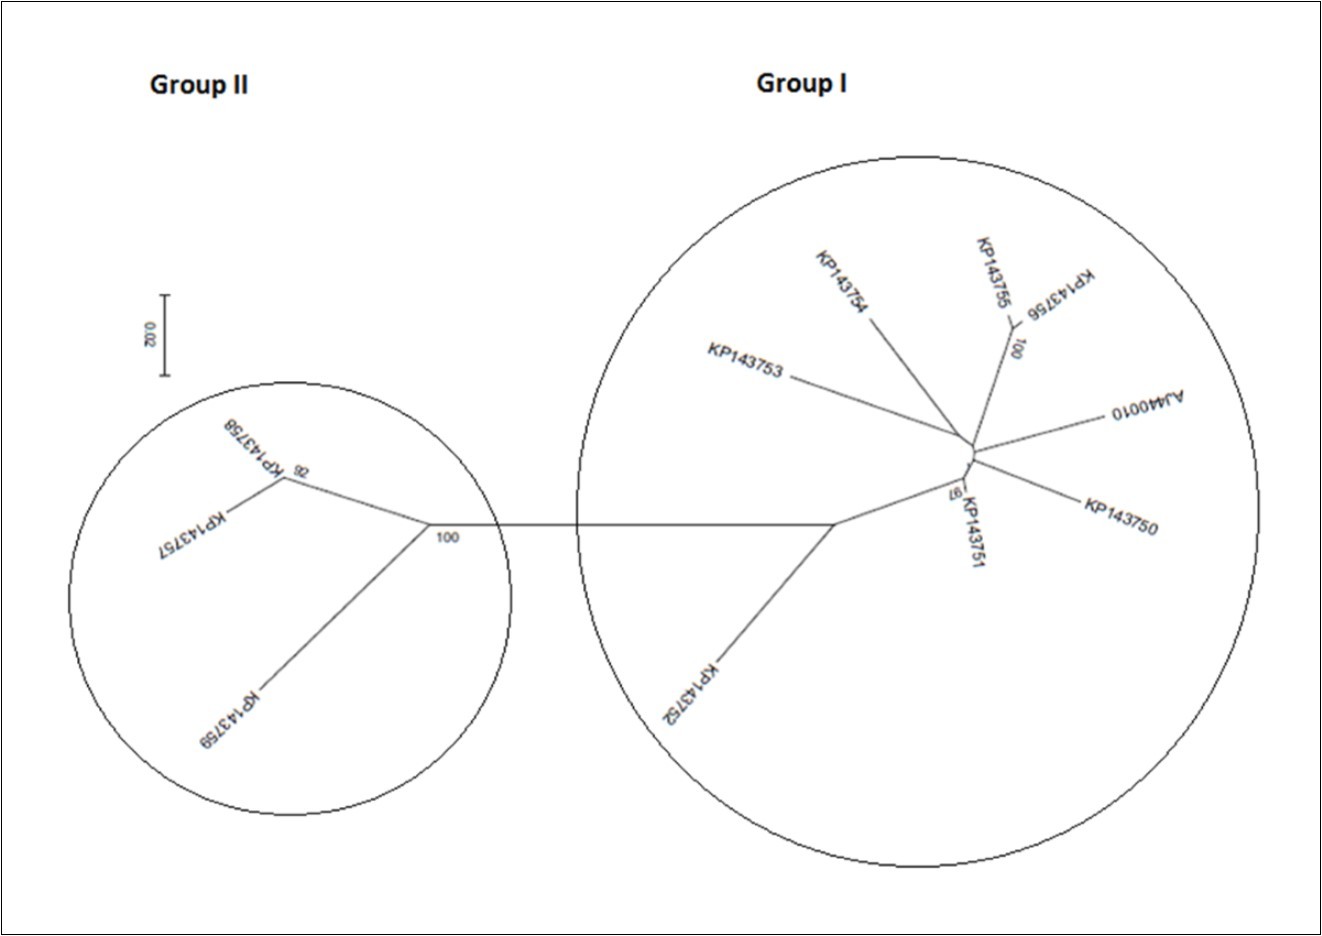
Figure 4b.586-667bp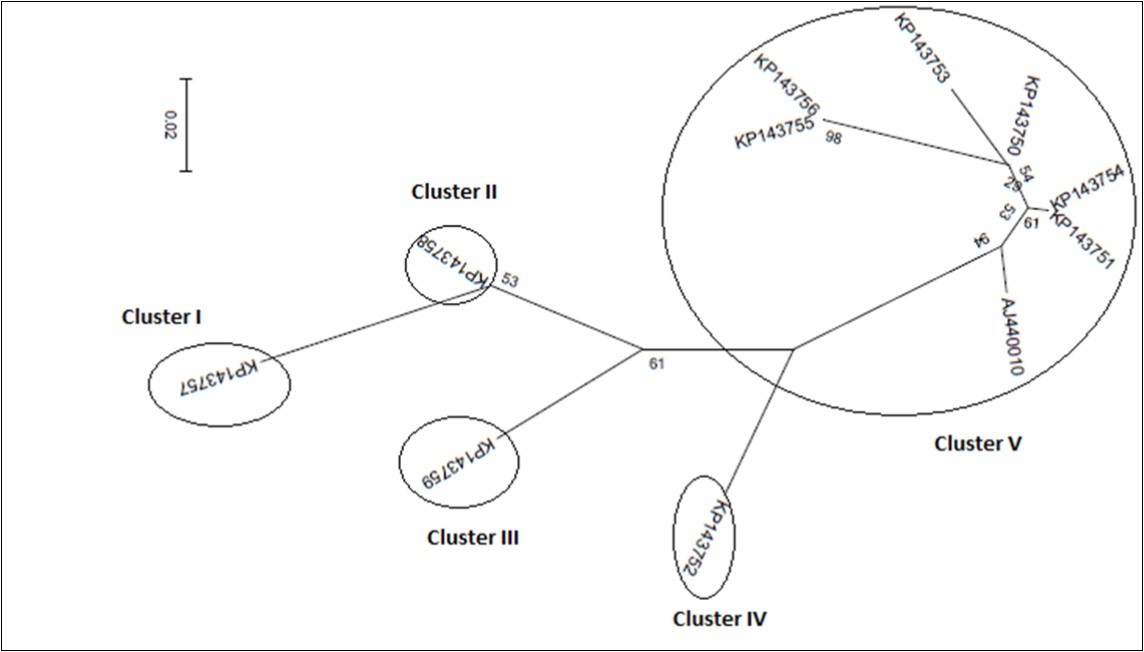
Figure 4c.100-375 bp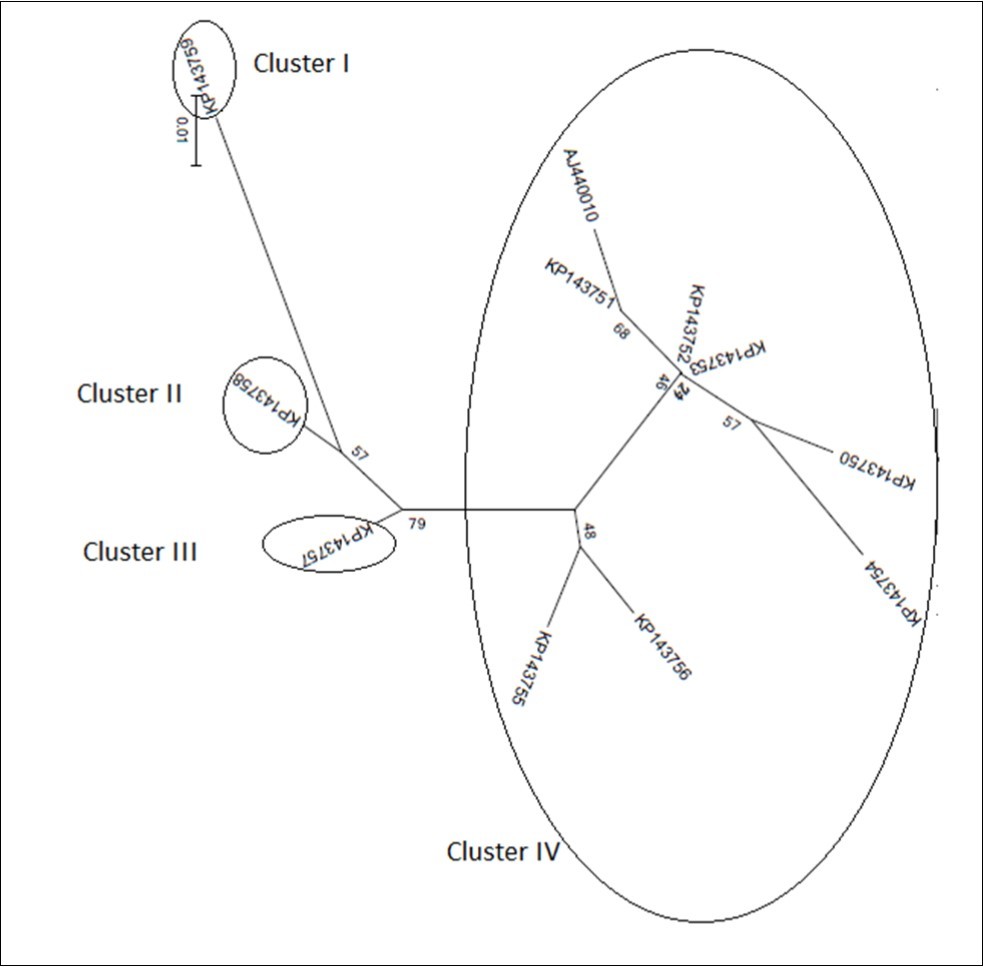
Figure 4d.and 376-585 bp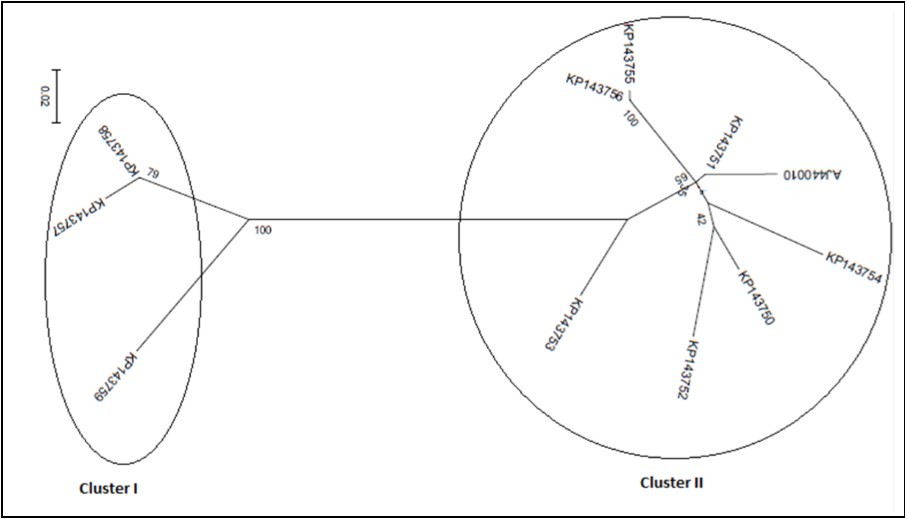
Figurre 4e.According to best fit Maximum Likelihood model, the trees were reconstructed using MEGA6 software incorporating the ML algorithm under assumption of the Models T92+G, K2, K2, K2+G, and K2, respectively. Bootstrap analysis was performed with 1,000 replicates. The numbers above the branches indicate the bootstrap confidence value. The scale bar shows the number of substitution per nucleotide.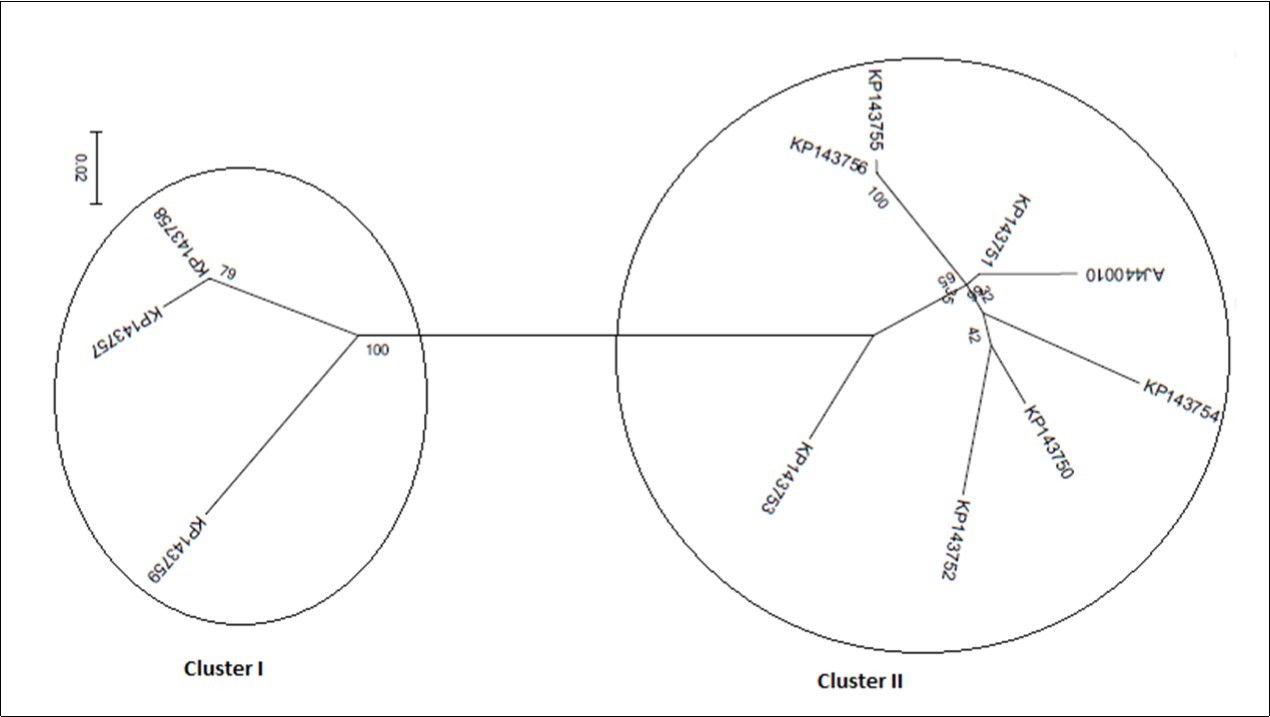
Figure 5.GARD tree reconstruction of the HSP70h partial gene segments spanning 1-99 bp (Fig. 5a), 100-375 bp (Fig. 5b), 376-585 bp (Fig. 5c), and 586-666 bp (Fig. 5d), respectively. In each tree, three even four clusters with different topologies were delineated. Scale bar indicates the number of substitutions per nucleotide.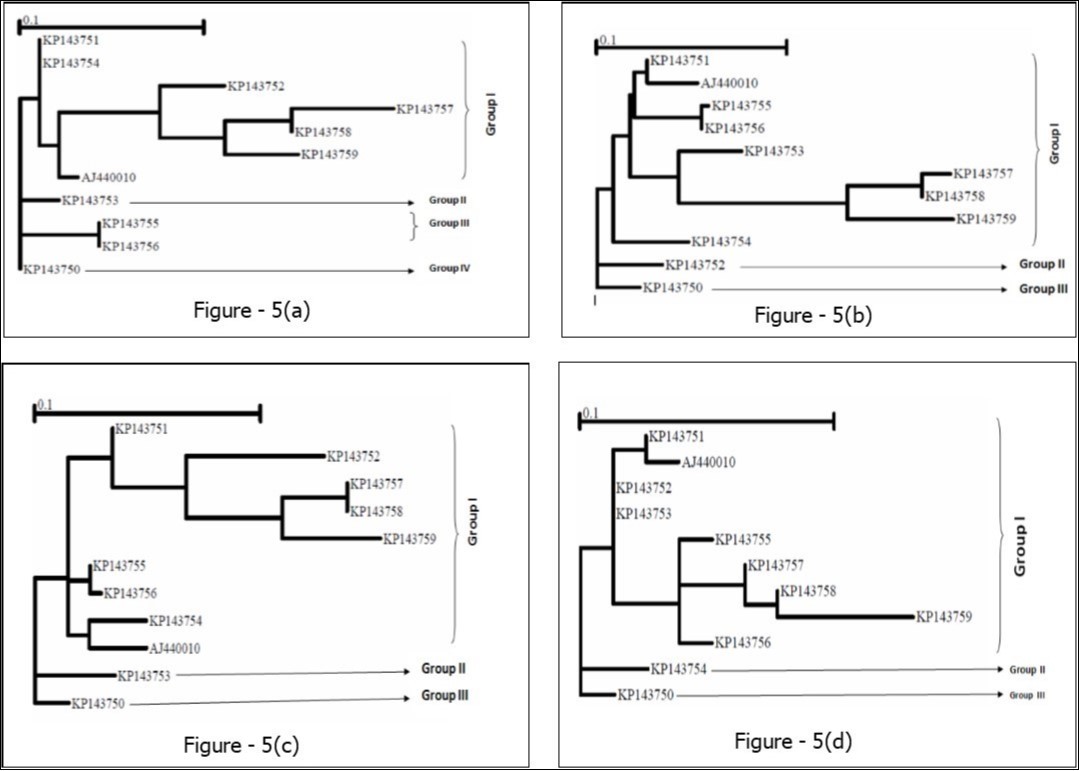
| Gene | cAIC | Δ cAIC | Breakpoint location | LHSp-value | RHSp-value | Significance |
| HSP70h | 4330.24 | 3.76926 | 99 | 0.16140 | 0.00660 | N.S. |
| 375 | 0.00060 | 0.05400 | * | |||
| 585 | 0.01080 | 0.00060 | ** |
Figure 6.GARD plot displaying potential recombination breakpoints within HSP70h partial gene of OLYaV.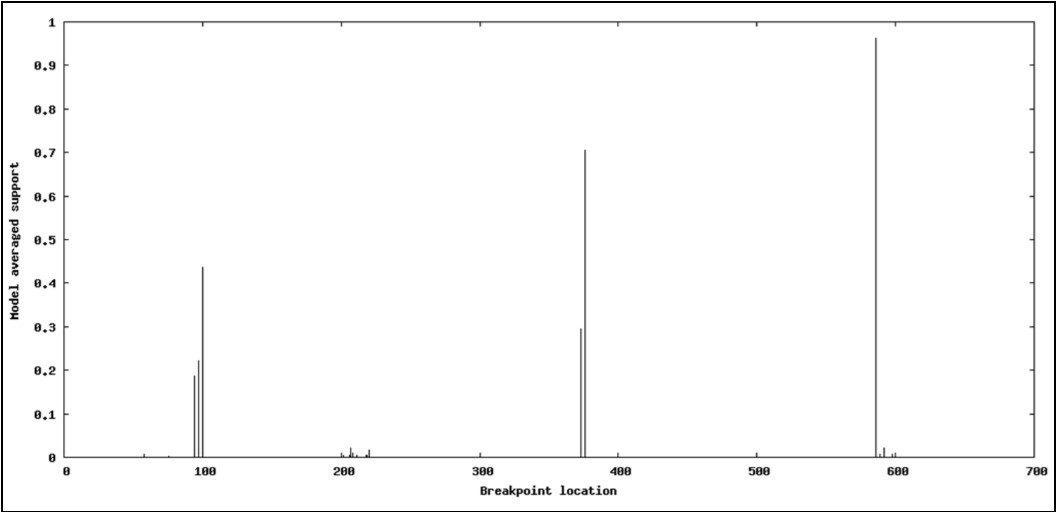
To examine whether the number of segregating sites in the sequences departs from the neutral expectation, the software DnaSP version 5.10.01 was used. It allowed the calculation of Tajima’s D as well as Fu and Li’s D and F statistical tests to assess the neutrality and influence of demographic forces on the population which were as the following: Tajima’s D = -0.23234 (not significant at p > 0.1), Fu and Li’s D = -0.08937 and Fu and Li’s F = -0.14339 (not significant at p > 0.1) (Table 4). The calculation was based on the total number of mutations. The significantly negative values of Tajima’s D, and Fu and Li’s D and F statistical tests for HSP70h partial sequences discounted the neutral hypothesis suggesting the occurrence of purifying selection and demographic expansion of OLYaV population. Furthermore, the selection profiles of HSP70h partial sequences were determined by submitting the sequence alignments to SNAP program where averages of all pairwise comparisons led to the conclusion that a purifying selection (dN<dS) occurred. In fact the terms dN and dS were as following: dN = 0.0238; dS = 0.3978, dN/dS = 0.0598 (Table 4). Afterwards, in the HyPhy package, available at the datamonkey server which implements various models of evolution, investigations site-by-site of the signature of selective pressure based on dN/dS ratio by applying the SLAC, FEL, IFEL, REL and FUBAR methods which incorporate non-synonymous as well as synonymous rate variation among codon sites explicitly, were conducted. While SLAC (0.1 significance level) (Table 5a) and FUBAR (posterior ptobability p ≥ 0.9) (Table 5b) detected only negatively selected sites, i.e. 23, and 90 codons, respectively, IFEL (0.1 significance level) (Table 5c), FEL (0.1 significance level) (Table 5d), and REL (p=0.02) (Table 5e) detected at the same time sites under positive selection, i.e. 1, 1, and 4 adaptively selected sites, respectively, and sites under purifying selection, i.e., 31, 72, and 1 negatively selected sites, respectively. Since the majority of the codons were under purifying selection, MEME model found three signatures of episodic diversifying selection (at the 0.1 significance level) (Table 5f). Use of the PARRIS method resulted in detection of negative selection at p < 0.1 (Table 5g) in aligned sequences of HSP70h-partial gene as given by inferred distribution rates for the null (M1) and alternative models (M2) mentioned in Table 5g. It is noteworthy that codon 82 was found to be under positive selection by both methods MEME and IFEL. Whereas, codon 220 was detected as adaptively selected site by three methods: FEL, REL, and MEME (Table 5d,Table 5e and Table 5f). To gain further insight into the lineage specific nature of the selective pressures acting on each branch of the phylogenetic tree, analyses using a genetic algorithm, namely GA-Branch, were performed. GA-Branch selected three classes with the support of 2512 models at 95% confidence set and a cAIC having the value 4046.03 (∆cAIC = 0.418914). A total of 19 branches were enumerated (Figure 7) and segregated into three parts. Whereas the first class was constituted by 10 branches, the second class was formed by four branches, and the third class comprised five branches whose dN/dS ratios were 0.0725866, 0, and 0.240833, respectively. Thus, all 19 branches were under negative selection. In corroborating the results found above, PRIME, an additional algorithm recently incorporated in HyPhy package was used in searching for which physico-chemical property of amino acids able to drive substitution according to two models: Conant-Stadler and Atchley. Based on Atchley model, it was demonstrated that two detected codons, i.e. 4, and 82, had each of them one conserved property and one changing property. While codon 4 had a changing property [the volume (α3)] with the value -3.154 (property importance) at p = 0.032, and a conserved property (charge/iso-electric point (α5) with the value 7.343 at p = 0.040, codon 82 had also on the one hand a changing property [polarity index (α1)] with the value -3.808 (property importance) at p = 0.028, and on the other hand a conserved property (refractivity/heat capacity (α4) with the value 4.363 (property importance) at p = 0.030. In other words, these two codons were both under purifying selection as well as adaptive selection. Consequently, exchangeabilities in HSP70h-partial gene seemed to be influenced by physico-chemical properties of amino acids, but only four types out of 10 properties were able to contribute to the evolution of the sequences. It is worth noting that no results were obtained with Conant-Stadler model.
Table 4. Population genetic parameters and neutrality tests calculated for the HSP70h partial gene. M = number of sequences , S = number of segregating sites, θ = the statistic θ from the number of segregation sites (S) (Watterson θ estimator) and the average of synonymous and non-synonymous substitutions, Π = nucleotide diversity (estimated by the average number of nucleotide differences between two random sequences in a population), Hd = haplotype diversity, ΔHd = the variance of haplotype diversity, K = Average of number of pairwise nucleotide differences , +Tajima’s D and Fu and Li’s D and F tests measure the departure from neutrality for all mutation in HSP70h partial gene. *Average of all pairwise comparisons.(http://www.hiv.lanl.gov/cgi-bin/SNAP/WEBSNAP/SNAP.cgi)| Population statistics | Test of neutrality + | Synonymous and non–synonymous statistics after SNAP algorithm * | ||||||||||
| M | S | θ | Π | Hd | ΔHd | K | Tajima’s statistics | Fu and Li’s F statistics | Fu and Li’s D statistics | dN | d S | dN/d S |
| 11 | 175 | 0.09316 | 0.08867 | 1.00 | 0.00150 | 59.145 | -0.23234 | -0.14339 | -0.08937 | 0.0238 | 0.3978 | 0.0598 |
| SLAC Model | Codon | dN-dS | NormalizeddN-dS | p-value |
| Negatively | 10 | -1.97201 | -4.92061 | 0.0913056 |
| selected | 15 | -2.95801 | -7.38092 | 0.0275897 |
| sites | 23 | -1.97201 | -4.92061 | 0.0913056 |
| 30 | -1.97201 | -4.92061 | 0.0913056 | |
| 35 | -1.97201 | -4.92061 | 0.0913056 | |
| 44 | -3.57527 | -8.92111 | 0.0123457 | |
| 55 | -1.97201 | -4.92061 | 0.0913056 | |
| 59 | -2.68145 | -6.69084 | 0.037037 | |
| 62 | -3.94402 | -9.84122 | 0.00833671 | |
| 67 | -3.83349 | -9.56544 | 0.07772 | |
| 75 | -3.57527 | -8.92111 | 0.0123457 | |
| 91 | -2.26985 | -5.66379 | 0.0741817 | |
| 110 | -2.68145 | -6.69084 | 0.037037 | |
| 126 | -1.97201 | -4.92061 | 0.0913056 | |
| 138 | -3.57527 | -8.92111 | 0.0123457 | |
| 153 | -1.97201 | -4.92061 | 0.0913056 | |
| 155 | -2.68145 | -6.69084 | 0.037037 | |
| 188 | -1.97201 | -4.92061 | 0.0913056 | |
| 192 | -2.32631 | -5.80467 | 0.069136 | |
| 195 | -2.68145 | -6.69084 | 0.037037 | |
| 201 | -1.97201 | -4.92061 | 0.0913056 | |
| 204 | -1.97201 | -4.92061 | 0.0913056 | |
| 206 | -1.97201 | -4.92061 | 0.0913056 |
| FUBAR Model | Codon | α | β | β- α | Posterior probability β< α |
| Negatively | 7 | 0.376525 | 0.0482881 | -0.328237 | 0.91319 |
| Selected | 10 | 1.01519 | 0.0456949 | -0.969495 | 0.967528 |
| Sites | 11 | 0.455078 | 0.0448951 | -0.410183 | 0.935291 |
| 15 | 2.61849 | 0.0595076 | -2.55898 | 0.991581 | |
| 20 | 0.492294 | 0.047063 | -0.445231 | 0.932668 | |
| 23 | 0.895002 | 0.0503206 | -0.844682 | 0.962082 | |
| 25 | 0.521667 | 0.058624 | -0.463043 | 0.900604 | |
| 26 | 0.369219 | 0.0503314 | -0.318888 | 0.914685 | |
| 30 | 0.544195 | 0.0447714 | -0.499424 | 0.955598 | |
| 32 | 0.375424 | 0.0564002 | -0.319023 | 0.900405 | |
| 33 | 0.922784 | 0.0518401 | -0.870944 | 0.962434 | |
| 35 | 1.36873 | 0.0460378 | -1.3227 | 0.980008 | |
| 41 | 1.15635 | 0.0532465 | -1.1031 | 0.985075 | |
| 44 | 1.62073 | 0.0536177 | -1.56711 | 0.996202 | |
| 50 | 0.315945 | 0.0503845 | -0.26556 | 0.902535 | |
| 54 | 0.683067 | 0.049905 | -0.633162 | 0.958644 | |
| 55 | 1.35989 | 0.0524097 | -1.30748 | 0.970511 | |
| 59 | 0.588387 | 0.049929 | -0.538458 | 0.9555 | |
| 60 | 1.15795 | 0.0505032 | -1.10745 | 0.978787 | |
| 62 | 2.17435 | 0.0554162 | -2.11894 | 0.995938 | |
| 67 | 0.800283 | 0.0418359 | -0.758447 | 0.959242 | |
| 75 | 2.93152 | 0.0573228 | -2.8742 | 0.999472 | |
| 76 | 0.812665 | 0.0414693 | -0.771196 | 0.973929 | |
| 77 | 0.403859 | 0.0576326 | -0.346226 | 0.927378 | |
| 80 | 0.350879 | 0.0464663 | -0.304412 | 0.914935 | |
| 87 | 3.47983 | 0.0775901 | -3.40224 | 0.985108 | |
| 89 | 0.873739 | 0.0518223 | -0.821917 | 0.940992 | |
| 90 | 0.897773 | 0.0531118 | -0.844661 | 0.942366 | |
| 91 | 1.85109 | 0.0552167 | -1.79587 | 0.983054 | |
| 93 | 0.756641 | 0.0420503 | -0.714591 | 0.970106 | |
| 94 | 0.424848 | 0.0467753 | -0.378072 | 0.947464 | |
| 95 | 1.84316 | 0.0460251 | -1.79713 | 0.983607 | |
| 97 | 0.607864 | 0.0514706 | -0.556393 | 0.93042 | |
| 99 | 0.453983 | 0.0469972 | -0.406986 | 0.930995 | |
| 102 | 0.870746 | 0.0623283 | -0.808418 | 0.905165 | |
| 105 | 0.430765 | 0.0521587 | -0.378606 | 0.938245 | |
| 106 | 1.27912 | 0.0532653 | -1.22586 | 0.996594 | |
| 109 | 0.923667 | 0.0540133 | -0.869654 | 0.935368 | |
| 110 | 1.09897 | 0.0385232 | -1.06045 | 0.991653 | |
| 111 | 0.428189 | 0.0411385 | -0.38705 | 0.957295 | |
| Negatively | 112 | 0.366705 | 0.0510693 | -0.315636 | 0.904948 |
| Selected | 115 | 0.443421 | 0.05616 | -0.387261 | 0.935545 |
| Sites | 116 | 0.410196 | 0.0436296 | -0.366566 | 0.933641 |
| 118 | 0.338126 | 0.060822 | -0.277304 | 0.911567 | |
| 122 | 0.366705 | 0.0510693 | -0.315636 | 0.904948 | |
| 123 | 0.643768 | 0.0536651 | -0.590103 | 0.954154 | |
| 124 | 0.923667 | 0.0540133 | -0.869654 | 0.935368 | |
| 125 | 1.32003 | 0.0492819 | -1.27074 | 0.973421 | |
| 126 | 1.1893 | 0.0483109 | -1.14099 | 0.968835 | |
| 129 | 0.577151 | 0.0491697 | -0.527982 | 0.920347 | |
| 135 | 0.919261 | 0.0524697 | -0.866792 | 0.938291 | |
| 137 | 0.518636 | 0.0521278 | -0.466508 | 0.914708 | |
| 138 | 1.31968 | 0.049073 | -1.27061 | 0.994411 | |
| 141 | 0.651402 | 0.0480894 | -0.603313 | 0.964091 | |
| 143 | 0.36261 | 0.0466886 | -0.315921 | 0.916419 | |
| 146 | 0.384867 | 0.0510885 | -0.333779 | 0.911193 | |
| 148 | 0.386554 | 0.0471416 | -0.339413 | 0.920311 | |
| 151 | 0.518636 | 0.0521278 | -0.466508 | 0.914708 | |
| 152 | 0.437827 | 0.047596 | -0.390231 | 0.927345 | |
| 153 | 1.93543 | 0.0506751 | -1.88476 | 0.97741 | |
| 155 | 1.91207 | 0.0446616 | -1.86741 | 0.997526 | |
| 157 | 0.368715 | 0.0475331 | -0.321182 | 0.917491 | |
| 158 | 1.09207 | 0.0458234 | -1.04625 | 0.98401 | |
| 161 | 0.380027 | 0.0468234 | -0.333203 | 0.922408 | |
| 162 | 0.557184 | 0.0525124 | -0.504672 | 0.928791 | |
| 163 | 0.418799 | 0.0530538 | -0.365746 | 0.913946 | |
| 164 | 0.369178 | 0.0481584 | -0.321019 | 0.913452 | |
| 169 | 0.876945 | 0.0533388 | -0.823606 | 0.938637 | |
| 171 | 0.40689 | 0.0495071 | -0.357383 | 0.921078 | |
| 175 | 0.894541 | 0.0515968 | -0.842944 | 0.944597 | |
| 176 | 0.57468 | 0.0506531 | -0.524027 | 0.921218 | |
| 177 | 0.386554 | 0.0471416 | -0.339413 | 0.920311 | |
| 179 | 0.983744 | 0.0424601 | -0.941284 | 0.975106 | |
| 180 | 0.386554 | 0.0471416 | -0.339413 | 0.920311 | |
| 182 | 0.428362 | 0.0428762 | -0.385486 | 0.954511 | |
| 183 | 0.923667 | 0.0540133 | -0.869654 | 0.935368 | |
| 184 | 0.473183 | 0.0553586 | -0.417824 | 0.913902 | |
| 186 | 0.45382 | 0.0466407 | -0.40718 | 0.926122 | |
| 187 | 0.36261 | 0.0466886 | -0.315921 | 0.916419 | |
| 188 | 0.64281 | 0.0462455 | -0.596565 | 0.953451 | |
| 191 | 0.469009 | 0.0455844 | -0.423425 | 0.925376 | |
| 192 | 5.86336 | 0.0718329 | -5.79153 | 0.998808 | |
| 195 | 0.966169 | 0.0410356 | -0.925133 | 0.988749 | |
| 196 | 1.03519 | 0.0549933 | -0.980194 | 0.921603 | |
| 197 | 0.436485 | 0.0492842 | -0.387201 | 0.923837 | |
| 199 | 0.366705 | 0.0510693 | -0.315636 | 0.904948 | |
| 201 | 1.25258 | 0.0516082 | -1.20097 | 0.972552 | |
| 204 | 1.96 | 0.0546179 | -1.90538 | 0.974545 | |
| 206 | 4.03781 | 0.0649555 | -3.97286 | 0.983705 | |
| 207 | 0.592155 | 0.0427802 | -0.549375 | 0.962824 |
| IFEL Model | Codon | dN | dS | dS/dN | NormalizeddN-dS | p-value |
| Negatively | 10 | 2.87875 | 0 | 0.000 | -7.18315 | 0.0950597 |
| selected | 15 | 8.86782 | 0 | 0.000 | -22.1273 | 0.0381136 |
| sites | 35 | 4.55354 | 0 | 0.000 | -11.3621 | 0.056537 |
| 41 | 4.21022 | 0 | 0.000 | -10.5055 | 0.0800715 | |
| 44 | 5.81412 | 0 | 0.000 | -14.5076 | 0.0333948 | |
| 55 | 3.80051 | 0 | 0.000 | -9.48315 | 0.0904535 | |
| 60 | 4.38885 | 0 | 0.000 | -10.9512 | 0.0660975 | |
| 62 | 5.40726 | 0 | 0.000 | -13.4924 | 0.0399924 | |
| 67 | 6.00319 | 0 | 0.000 | -14.9794 | 0.0504539 | |
| 69 | 4.95666 | 0 | 0.000 | -12.368 | 0.0388506 | |
| 75 | 10.4746 | 0 | 0.000 | -26.1365 | 0.00356791 | |
| 76 | 3.47216 | 0 | 0.000 | -8.66386 | 0.0659542 | |
| 87 | 10.8158 | 0 | 0.000 | -26.9879 | 0.0466957 | |
| 90 | 4.59962 | 0 | 0.000 | -11.4771 | 0.0986656 | |
| 91 | 7.03144 | 0 | 0.000 | -17.5451 | 0.0378984 | |
| 93 | 3.31213 | 0 | 0.000 | -8.26452 | 0.0775172 | |
| 95 | 8.17657 | 0 | 0.000 | -20.4024 | 0.045526 | |
| 106 | 5.26575 | 0 | 0.000 | -13.1393 | 0.0526288 | |
| 110 | 4.462 | 0 | 0.000 | -11.1337 | 0.0355557 | |
| 125 | 8.24749 | 0 | 0.000 | -20.5794 | 0.0564762 | |
| 138 | 4.67957 | 0 | 0.000 | -11.6766 | 0.0477805 | |
| 153 | 11.3135 | 0 | 0.000 | -28.2299 | 0.0474348 | |
| 155 | 8.39498 | 0 | 0.000 | -20.9474 | 0.00765174 | |
| 158 | 5.69615 | 0 | 0.000 | -14.2132 | 0.0320832 | |
| 175 | 4.59949 | 0 | 0.000 | -11.4768 | 0.0922158 | |
| 179 | 3.8005 | 0 | 0.000 | -9.48314 | 0.0601061 | |
| 192 | 78.0962 | 0 | 0.000 | -194.868 | 0.00173726 | |
| 195 | 3.81155 | 0 | 0.000 | -9.51071 | 0.0561057 | |
| 201 | 3.99332 | 0 | 0.000 | -9.96426 | 0.0836751 | |
| 204 | 8.2942 | 0 | 0.000 | -20.696 | 0.0623541 | |
| 206 | 5314.18 | 0 | 0.000 | -13260.1 | 0.0118554 | |
| Positively selected site | 82 | 0 | 6.06023 | Infinite | 15.1217 | 0.0519717 |
| FEL Model | codon | dS | dN | dN/dS | NormalizeddN-dS | p-value |
| Negatively | 10 | 2.87884 | 0 | 0.000 | -7.18338 | 0.0276303 |
| selected | 11 | 2.30241 | 0 | 0.000 | -5.74504 | 0.0589999 |
| sites | 15 | 8.86782 | 0 | 0.000 | -22.1273 | 0.00718757 |
| 20 | 2.23505 | 0 | 0.000 | -5.57697 | 0.0663179 | |
| 23 | 2.91352 | 0 | 0.000 | -7.26992 | 0.0362612 | |
| 26 | 1.57283 | 0 | 0.000 | -3.92457 | 0.0954015 | |
| 30 | 1.89029 | 0 | 0.000 | -4.71672 | 0.0421214 | |
| 33 | 3.78636 | 0 | 0.000 | -9.44785 | 0.0327252 | |
| 35 | 4.55342 | 0 | 0.000 | -11.3618 | 0.0131776 | |
| 41 | 4.21022 | 0 | 0.000 | -10.5055 | 0.0162333 | |
| 44 | 5.81392 | 0 | 0.000 | -14.5071 | 0.00422218 | |
| 54 | 2.82908 | 0 | 0.000 | -7.05921 | 0.0381106 | |
| 55 | 3.80051 | 0 | 0.000 | -9.48315 | 0.0256626 | |
| 59 | 2.20792 | 0 | 0.000 | -5.50928 | 0.0470725 | |
| 60 | 4.38873 | 0 | 0.000 | -10.9509 | 0.0151289 | |
| 62 | 5.40726 | 0 | 0.000 | -13.4924 | 0.00554271 | |
| 67 | 6.00319 | 0 | 0.000 | -14.9794 | 0.0199245 | |
| 75 | 10.4746 | 0 | 0.000 | -26.1365 | 0.000184154 | |
| 76 | 3.47209 | 0 | 0.000 | -8.66366 | 0.0170004 | |
| 77 | 1.83673 | 0 | 0.000 | -4.58307 | 0.0799872 | |
| 87 | 10.8158 | 0 | 0.000 | -26.9879 | 0.0112877 | |
| 89 | 4.12611 | 0 | 0.000 | -10.2956 | 0.0449104 | |
| 90 | 4.59949 | 0 | 0.000 | -11.4768 | 0.0407129 | |
| 91 | 7.03144 | 0 | 0.000 | -17.5451 | 0.00834995 | |
| 93 | 3.31213 | 0 | 0.000 | -8.26452 | 0.0215954 | |
| 94 | 1.68988 | 0 | 0.000 | -4.21665 | 0.0522862 | |
| 95 | 8.17657 | 0 | 0.000 | -20.4024 | 0.0121216 | |
| 97 | 2.98447 | 0 | 0.000 | -7.44694 | 0.0608662 | |
| 99 | 2.30234 | 0 | 0.000 | -5.74488 | 0.0622687 | |
| 102 | 3.18138 | 0 | 0.000 | -7.93829 | 0.0544263 | |
| 105 | 1.69934 | 0 | 0.000 | -4.24024 | 0.0706894 | |
| 106 | 5.26575 | 0 | 0.000 | -13.1393 | 0.00637464 | |
| 109 | 3.62226 | 0 | 0.000 | -9.03838 | 0.0569133 | |
| 110 | 4.46188 | 0 | 0.000 | -11.1334 | 0.00555655 | |
| 111 | 1.68988 | 0 | 0.000 | -4.21665 | 0.0405256 | |
| 115 | 1.97076 | 0 | 0.000 | -4.91751 | 0.0662502 | |
| 116 | 1.90796 | 0 | 0.000 | -4.76082 | 0.0674488 | |
| 123 | 2.73036 | 0 | 0.000 | -6.81288 | 0.0462351 | |
| 124 | 3.62226 | 0 | 0.000 | -9.03838 | 0.0569133 | |
| 125 | 8.24749 | 0 | 0.000 | -20.5794 | 0.0170062 | |
| 126 | 2.85992 | 0 | 0.000 | -7.13616 | 0.0294044 | |
| 129 | 1.63291 | 0 | 0.000 | -4.0745 | 0.0988515 | |
| 135 | 3.74326 | 0 | 0.000 | -9.34031 | 0.0519666 | |
| 138 | 4.67971 | 0 | 0.000 | -11.677 | 0.00694664 | |
| 141 | 3.16258 | 0 | 0.000 | -7.89138 | 0.0282591 | |
| 148 | 1.4131 | 0 | 0.000 | -3.52601 | 0.097974 | |
| 152 | 2.08777 | 0 | 0.000 | -5.20947 | 0.0694962 | |
| 153 | 11.3135 | 0 | 0.000 | -28.2299 | 0.0131378 | |
| 155 | 8.39498 | 0 | 0.000 | -20.9474 | 0.000766624 | |
| Negatively | 158 | 5.69615 | 0 | 0.000 | -14.2132 | 0.00631352 |
| selected | 161 | 1.45007 | 0 | 0.000 | -3.61826 | 0.091037 |
| sites | 162 | 3.1211 | 0 | 0.000 | -7.78787 | 0.0600393 |
| 163 | 2.02455 | 0 | 0.000 | -5.05174 | 0.0872654 | |
| 169 | 4.126 | 0 | 0.000 | -10.2953 | 0.0482113 | |
| 171 | 1.90796 | 0 | 0.000 | -4.76082 | 0.0796031 | |
| 175 | 4.59962 | 0 | 0.000 | -11.4771 | 0.0378602 | |
| 177 | 1.4131 | 0 | 0.000 | -3.52601 | 0.097974 | |
| 179 | 3.8005 | 0 | 0.000 | -9.48314 | 0.0151491 | |
| 180 | 1.4131 | 0 | 0.000 | -3.52601 | 0.097974 | |
| 182 | 1.72055 | 0 | 0.000 | -4.29317 | 0.0428165 | |
| 183 | 3.62226 | 0 | 0.000 | -9.03838 | 0.0569133 | |
| 184 | 2.41038 | 0 | 0.000 | -6.01445 | 0.0854211 | |
| 186 | 1.75413 | 0 | 0.000 | -4.37695 | 0.0814891 | |
| 188 | 1.79075 | 0 | 0.000 | -4.46834 | 0.0481462 | |
| 191 | 1.52175 | 0 | 0.000 | -3.79712 | 0.0936881 | |
| 192 | 78.0962 | 0 | 0.000 | -194.868 | 0.000186554 | |
| 195 | 3.81146 | 0 | 0.000 | -9.51048 | 0.010199 | |
| 197 | 2.0912 | 0 | 0.000 | -5.21802 | 0.07389 | |
| 201 | 3.99332 | 0 | 0.000 | -9.96426 | 0.0226521 | |
| 204 | 8.2942 | 0 | 0.000 | -20.696 | 0.0186686 | |
| 206 | 1457.28 | 0 | 0.000 | -3636.26 | 0.00354566 | |
| 207 | 2.31414 | 0 | 0.000 | -5.77433 | 0.0317939 | |
| PositivelySelected site | 220 | 1e-06 | 1.28249 | 1282490.000 | 3.20011 | 0.0905593 |
| REL Model | Codon | E(dS) | E (dN) | Normalized E(dN-dS) | Posterior Probability | Bayes Factor |
| Positively | 3 | 0.693586 | 0.664224 | -0.0293626 | 0.933881 | 123.309 |
| selected | 4 | 0.768286 | 0.664586 | -0.1037 | 0.884521 | 66.8707 |
| site | 82 | 0.775199 | 0.664852 | -0.110348 | 0.88026 | 64.1806 |
| 220 | 0.633177 | 0.664177 | 0.0310005 | 0.974124 | 328.664 | |
| Negatively selected site | 75 | 2.0235 | 0.0224856 | -2.00102 | 0.998862 | 100.564 |
| MEME | Codon | α | β - | Pr[β=β - ] | β + | Pr[β=β + ] | p-value | q-value |
| 27 | 0.0463014 | 0.0463014 | 0.895957 | 10000 | 0.104043 | 0.0232567 | 1 | |
| 82 | 0 | 0 | 0.932169 | 105.292 | 0.0678312 | 0.00336169 | 0.746294 | |
| 220 | 0 | 0 | 0.910884 | 29.2189 | 0.0891156 | 0.0121083 | 1 |
| PARRIS | Synonymous rate | ω (dN/dS) ratio | |||||||
| Coding region | Inferred Rate distributions | Rate Class | 1 | 2 | 3 | Rate class | 1 | 2 | 3 |
| HSP70 | Null Model (M1) | ds | 0.59 | 1.65 | 2.28 | ω | 0.01 | 1.00 | - |
| Probability | 0.613 | 0.387 | 0.000 | Probability | 0.873 | 0.127 | - | ||
| Alternative Model (M2) | ds | 0.59 | 1.64 | 1.68 | ω | 0.01 | 1.00 | 4.84 | |
| Probability | 0.613 | 0.243 | 0.144 | Probability | 0.873 | 0.127 | 0.000 | ||
Figure 7.Lineage specific analysis of selective pressure in HSP70h partial gene of OLYaV. A cladogram is shown with Maximum-Likelihood Estimates of lineage-specific dN/dS during HSP70h partial gene evolution. Percentages for branch classes in the legend reflect the proportion of total tree length (measured in expected substitutions per site per unit time) evolving under the corresponding value of dN/dS.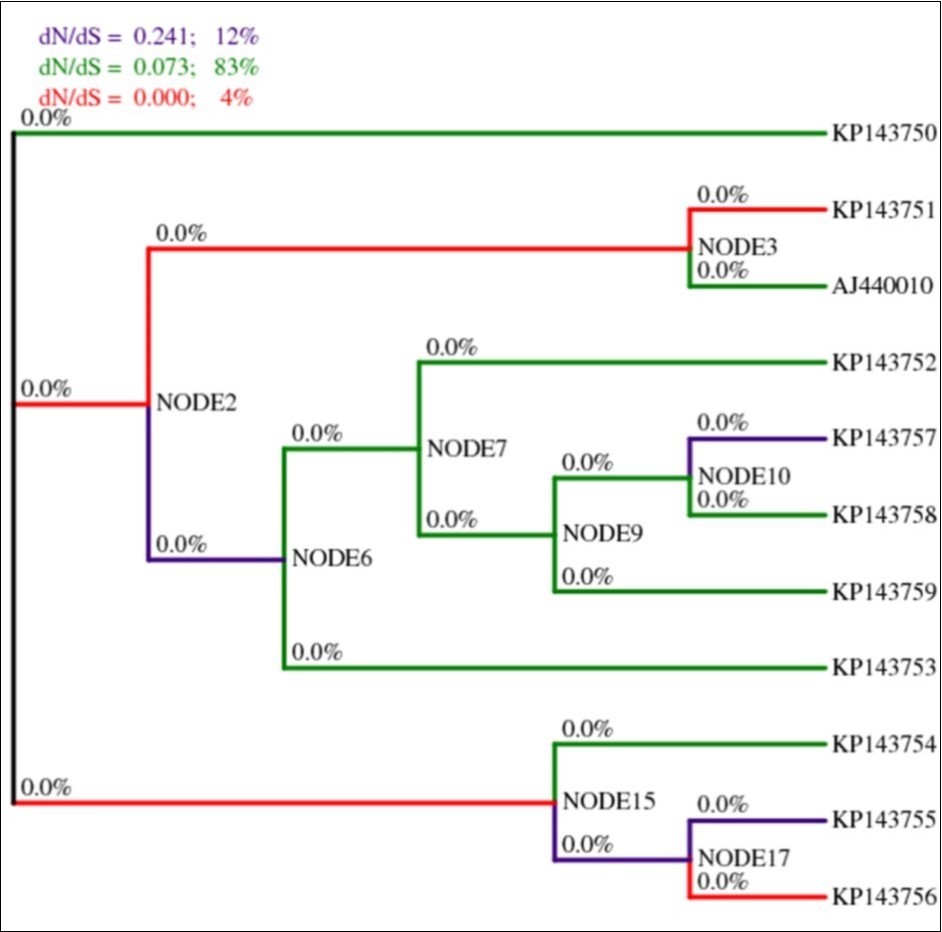
Discussion
Populations of plant viruses are genetically heterogeneous, and the frequency distribution of genetically varied entities in the population may fluctuate with time. This process is known as evolution. The variability of virus population led to the notion of quasispecies which assumes high mutation rates for RNA viruses. Since the presence of high mutation rates of RNA viruses and high accumulation levels in plant cells, RNA viruses have large and highly diverse populations. Consequently, viral populations would easily respond to changing selection pressure, and the evolution of high mutation rates would have an adaptive behaviour, allowing the virus to survive in changing environments. Since not accounting for other evolution forces such as recombination which can mislead not only phylogenetic analyses, but can increase the false positive error rate in positive selection inference. In this study, the author sought after recombination in the sequence of a portion (667 bp) of HSP70h-coding gene of OLYaV of 10 Tunisian accessions along with a reference sequence extracted from GenBank (Accession number AJ440010). In fact, three methods were used: DSS implemented in TOPALi v2.5 program, SBP, and GARD, both incorporated in HyPhy package. While the two former detected only a single breaking point, i.e. positions 380, and 369, respectively, the latter attempted to find all recombination signals in the genomic segment 667 bp. The breakpoints that were found in GARD analysis corresponded to hot spots particularly in positions 99, 375, and 585 bp. GARD, a powerful tool screened multiple-sequence alignments for recombination, determined all possible locations of breakpoints, inferred phylogenies for each putative non recombinant fragment and assessed goodness of fit by an information-based criterion such as small sample Akaike Information Criterion (AIC) 46. AICc derived from a maximum likelihood model fit to each segment 47. Thus, since putative recombination events occurred, inferred phylogeny produced by MEGA6 software does no longer reflect the real evolutionary process of the analyzed sequences (Figure 4a). Therefore, different tree topologies were necessary. Using MEGA6 software, only two separated sequence sets, i.e., segments 1-99 bp and 586-667 bp gave rise to two different tree topologies (Figure 4b, Figure 4c) compared to the segments 100-375 bp (Figure 4d), and 376-585bp (Figure 4e) which were identical to reconstructed tree without taking into account recombination (Figure 4a). According to statistical data, GARD reconstructed trees on both the left and the right sides of breaking points resulted in no significant incongruence topology at p = 0.1 around breakpoint 99. In contrast, topologies were incongruent at significance levels p = 0.1 around breakpoint 375, and p = 0.05 around breakpoint 585. Consequently, the affiliation of the isolates to different clusters was reshuffled. In addition to differences based on genome composition, viruses are expected to face widely different selection pressures depending on the taxon of the organisms that they infect. Comparison of synonymous and non-synonymous substitution rates provides an important means for studying the mechanisms of sequence evolution. In order to avoid false positive rates in selective pressures, different models (SLAC, FEL, IFEL, REL, FUBAR, PARRIS) incorporated in the HyPhy package which all take recombination into account, were used. These analyzes permitted to show that the majority of codons were under negative selection. This result was congruent with the results given by SNAP program as well as by Tajima’s D and Fu and Li’s D and F tests indicating a deviation from the null hypothesis and a demographic expansion. However, a few codons were positively selected, as pointed out by the MEME model which evidenced episodic diversifying selection at individual sites. Similarly, IFEL, FEL, and REL models detected 1, 1, and 4 positively selected sites, respectively. To characterize further the evolution of HSP70h-partial gene and detect possible differences of selective pressure between different branches among the gene phylogeny, a more refined analysis using GA-Branch model allowing for dN/dS ratio to vary between branches, was performed. The results provided support for all phylogenetic branches that were under negative selection (Figure 7). PRIME program, however, indicated that purifying and adaptive selection signatures prevailed as well.
Nowadays, 15 different viruses infecting olive with diverse taxonomic allocation are described 11. Substantial efforts and considerable attention were paid by several workers particularly from Mediterranean and Middle Eastern countries to characterize molecularly different viruses infecting olive. Unfortunately, knowledge about genetic factors driving their evolution is still scarce. For example, Cardoso et al. 48 reported that Olivemild mosaic virus is a recombinant between Olive latent virus 1 (OLV-1) and Tobacco necrosis virus strain D (TNV-D). Varanda et al. 49 attempted to study selective constraints acting on OLV-1 CP gene using REL model. However, to date, and according to author’s best knowledge, this study described here is first report on molecular evolution of OLYaV based on the analysis of partially sequenced HSP70h-coding gene of 10 accessions collected from Tunisia along with the reference sequence AJ440010 downloaded from GenBank which is, by the way, the only one available in the databank which can provide a fragment as long as 667 bp. Such segment belongs to the larger genomic fragment of OLYaV sequenced so far representing no more than 25% of the genome of related viruses having a size between 15 and 20 Kb. Moreover, except the sequences of HSP70h gene (667 bp) of OLYaV described in this study, all those deposited to date in GenBank have a size ranging from 361 bp to 611 bp. It is worth noting that expected further studies on molecular evolution of viruses infecting olive should be undertaken.
Acknowledgments
The author is grateful to Ministry of Higher Education and IRESA (Institution de la Recherche et de l’Enseignement Supérieur Agricoles) of Ministry of Agriculture in Tunisia for providing funds to carry out this work.
Compliance with Ethical Standards
The author declares that he has no conflict of interest
References
- 1.D M Rand, L M Kann. (1998) Mutation and selection at silent and replacement sites in the evolution of animal mitochondrial DNA.Genetica,102/103:. 393-407.
- 2.Rao A L, Hall T C. (1993) Recombination and polymerase error facilitate restoration of infectivity in brome mosaic virus. , Journal of Virology 69, 969-979.
- 3.Fernandez-Cuartero B, Burgyan J, Aranda M A, Salanki K, Moriones et al. (1994) Increase in the relative fitness of a plant virus RNA associated with its recombinant nature. , Virology 203, 379-377.
- 4.White K A, Morris T J. (1994) Recombination between defective tombuvirus RNAs generated functional hybrid genomes. , Proc. Natl. Acad. Sci. USA 91, 3642-3646.
- 5.Nagy P D, Bujarski J J. (1995) Efficient system of homologous RNA recombination in brome mosaic virus: sequence and structure requirements and accuracy of crossovers. , Journal of Virology 69, 131-140.
- 6.Nagy P D, Bujarski J J. (1996) Homologous RNA recombination in brome mosaic virus: AU-rich sequences decrease the accuracy of crossovers. , Journal of Virology 70, 415-426.
- 7.Borja M, Rubio T, Scholthof H B, Jackson A O. (1997) Restoration of wild-type virus by double recombination of tombusvirus mutants with a host trangene. , Molecular Plant Microbe-Interaction 12, 153-162.
- 8.White K A, Nagy P D. (2004) Advances in the molecular biology of Tombusviruses: gene expression, genome replication, and recombination. , Progress in Nucleic Acid Res Mol Biol 78, 187-226.
- 9.Pathak K B, Nagy P D. (2009) Defective interfering RNAs: foes of viruses and friends of virologists. , Viruses 1, 895-919.
- 10.M El Air, Mahfoudhi N, Digiaro M, Najjar A, Elbeaino T. (2011) Detection of olive-infecting viruses in Tunisia. , Journal of Phytopathology 159(4), 286-286.
- 11.Martelli G P. (2013) A brief outline of infectious diseases of olive. , Palestine technical University Research Journal 1(1), 01-09.
- 12.Cutuli M, Campisi G, Marra F P, Caruso T. (2011) Vegetative growth and ecophysiological aspects in young olive plants inoculated with Olive leaf yellowing-associated virus.(OLYaV). , Acta Italus Hortus 1, 356-361.
- 13.Sabanadzovic S, Abou-Ghanem N, La Notte P, Savino V, Scarito G et al. (1999) Partial molecular characterization and RT-PCR detection of a putative closterovirus associated with Olive leaf yellowing. , Journal of Plant Pathology 81(1), 37-45.
- 14.Saponari M, Castellano M A, Grieco F, Savino V, Martelli G P. (2004) Further studies on Olive leaf yellowing-associated virus. , Journal of Plant Pathology 86, 332.
- 15.T El Beaino, Saponari M, Minafra A, Castellano M A, Savino V et al. (2005) Further characterization of Olive leaf yellowing-associated virus. , Journal of Plant Pathology 87(3), 223-228.
- 16.Rozen S, Skaletsky H J. (2000) Primer3 on the WWW for general users and for biologist programmers. In:. Bioinformatics Methods and Protocols: Methods in Molecular Biology. Eds. Krawetz S, Misener S, Humana Press , Totowa, NJ 365-386.
- 18.Sanger F, Nicklen S, Coulson A R. (1977) DNA sequencing with chain-terminating inhibitors. Proc Natl Acad Sci USA 74, 5463-5467.
- 20.Pearson W R, Lipman D J. (1988) Improved tools for biological sequence comparison. , Proc. Natl. Acad . Sci. USA 85, 2444-2448.
- 21.Altschul S F, Gish W, Miller W, Meyers E W, Lipman D J. (1990) Basic local alignment search tool. , J Mol Biol 215, 403-410.
- 22.Altschul S F, Boguski M S, Gish W, Wooton J C. (1994) Issues in searching molecular sequence databases. , Nat Genet 6, 119-129.
- 23.Larkin M A, Blackshileds G, Brown N P, Chenna R, McGettigan P A et al. (2007) . Clustal W and Clustal X version2.0.Bioinformatics 23 2947-2948.
- 24.Corpet F. (1988) Multiple sequence alignment with hierarchical clustering. , Nucleic Acids Research 16, 10881-10890.
- 25.Tamura K, Stecher G, Peterson D, Filipski A, Kumar S. (2013) MEGA6: Molecular Evolutionary Genetics Analysis version6.0.Mol Biol Evol. 30, 2725-2729.
- 26.Tamura K, Nei M. (1993) Estimation of the number of nucleotide substitutions in the control region of mitochondrial DNA in humans and chimpanzees. , Mol Biol Evol 10, 512-526.
- 27.Pond Kosakovsky, S L Posada, Gravenor D, M B Woelk, H C et al. (2006) GARD: a genetic algorithm for recombination detection. , Bioinformatics 22, 3096-3098.
- 28.Pond Kosakovsky, S L Posada, Gravenor D, M B Woelk, H C et al. (2006) Automated phylogenetic detection of recombination using a genetic algorithm. , Mol Biol Evol 23, 1891-1901.
- 29.Milne I, Wright F, Rowe G, D F Marshall, Husmeier D et al. (2004) TOPALi: software for automatic identification of recombinant sequences within DNA multiple alignments. , Bioinformatics 20(11), 1806-1807.
- 30.Akaike H. (1974) A new look at the statistical model identification. , IEEE Transactions on Automatic Control 19, 716-723.
- 31.Khishino H, Hasegawa M. (1989) Evaluation of the maximum likelihood estimate of the evolutionary tree topologies from DNA sequence data, and the branching order in Hominoidea. , Journal of Molecular Evolution 29, 170-179.
- 32.Pond Kosakovsky, S L Frost, S D W, S V Muse. (2005) HyPhy: hypothesis testing using phylogenies. , Bioinformatics 21, 676-679.
- 33.Rozasn J, J C Sanchez-DelBarrion, Messeguern X, Rozasn R. (2003) DnaSP, DNA polymorphism analyses by the coaslescent and other methods. , Bioinformatics 19, 2496-2497.
- 34.Tajima F. (1989) Statistical-method for testing the neutral mutation hypothesis by DNA polymorphism. , Genetics 123, 585-595.
- 36.G A Watterson. (1975) On the number of segregating sites in general models without recombination. , Theor Popul Biol 7, 256-276.
- 37.Korber B. (2000) HIV signatures and similarities. In:. computational and evolutionary analysis of HIV molecular sequences(ed. AG Rodrigo and GH Jr Learn),Kluwer Academic Publishers,Dordrecht,The Netherlands 55-72.
- 38.Kosakovsky Pond SL, SDW Frost. (2005) Datamonkey: rapid detection of selective pressure on individual sites of codon alignments. , Bioinformatics 21, 2531-2533.
- 39.Murrell B, Wertheim J O, Moola S, Weighill T, Scheffler K et al. (2012) Detecting individual sites subject to episodic diversifying selection.doi:. 10.1371/journal.pgen.1002764.PLOS Genetics 8: 1002764.
- 40.Murrell B, Moola S, Mabona A, Weighill T, Sheward D et al. (2013) FUBAR:A Fast, Unconstrained Bayesian AppRoximation for inferring selection. , Mol Biol Evol 30, 1196-1205.
- 41.Scheffler K, Martin D P, Seoighe C. (2006) Robust inference of positive selection from recombining coding sequences. , Bioinformatics 22, 2493-2499.
- 42.Delport W, AFY Poon, SDW Frost, Kosakovsky Pond S. (2010) Datamonkey 2010: a suite of phylogenetic analysis tools for evolutionary biology. , Bioinformatics 29, 2455-2457.
- 43.Kosakovsky Pond SL, SDW Frost. (2005) A genetic algorithm approach to detecting lineage-specific variation in selection pressure. , Mol. Biol. Evol 22, 478-485.
- 44.Conant G C, Wagner G P, Stadler P F. (2007) Modeling amino acid substitution pattern in orthologous genes. , Mol Phylogen Evol 42(2), 298-307.
- 45.Atchley W R, Zhao J, Fernandes A D, Druke T. (2005) Solving the protein sequence metric problem. , PNAS 102(18), 6395-6400.
- 46.Sugiura N. (1978) Further analysis of the data by Akaike’s information criterion and the finite corrections. Commun Stat Theory Meth A7 13-26.
- 47.Kosakovsky Pond SL, Frost S D, Grossman Z, Gravenor M B, Richman D D et al. (2006) Adaptation to different human populations by HIV-1 revealed by codon-based analyses. , PLOS Comput Biol 2, 530-538.
Cited by (1)
- 1.Langdon Quinn K., Peris David, Baker EmilyClare P., Opulente Dana A., Nguyen Huu-Vang, et al, 2019, Fermentation innovation through complex hybridization of wild and domesticated yeasts, Nature Ecology & Evolution, 3(11), 1576, 10.1038/s41559-019-0998-8