
Correlation of Fast Food Consumption and Overweight/Obesity among Undergraduate Students at the University of Hargeisa in Hargeisa, Somaliland
- Open Access
- Peer Reviewed
- Similarity Checked
- CC BY 4.0
Abstract
Background
Fast food consumption is the major cause of obesity and overweight in worldwide affecting more than 2 billion people, especially developing countries and low income countries. It can lead to hyperinsulinemia and development of insulin resistance, high energy density, high glycemic index, and fatty acid composition of fast foods may increase the prevalence of obesity and cardiovascular risk factors
Objectives
The main aim of this study was, to assess fast food consumption and its association with overweight /obesity among undergraduate students of University Hargeisa, Somaliland, 2023.
Methods
The study was carried out from May 01 to July 20, 2023 at University of Hargeisa using an institutional based cross-sectional study design to among 260 students. The study participants were selected using a simple random sampling technique. A structured questionnaire was prepared based on review literatures and dig out from related studies. The anthropometric data was taken by data collectors to measure weight and height using a stadiometer. Data was entered and checked for errors using EPI-info version 7.1.5.0 and then, data were exported to statistical package for social sciences (SPSS) software version 21 and STATA software version 14 for data processing and analysis. Descriptive statistics such as; frequencies, means and proportion was used for present the findings. A variable with P-values of less than 0.25 in the binary logistic regression analysis was entered into a multivariable logistic regression analysis to identify the independent predictors of stunting. Finally, variable at P-value less than 0.05 in multivariable logistic regression analysis was considered as a statistically significant variable.
Results
In this study, the majority 235 (90.4%, CI: 86.5- 93.8) of the study participants were fast food consumers. The study revealed that, from the total study participants 46(17.7%),127(48.8%),84(32.3%), 3(1.2%) were underweight, normal, overweight and obese respectively. A chi-square test revealed that there was a significant (p-value=0.058) associations between BMI and fast food consumption among students of University of Hargeisa. On multi-variable logistic regression model educational level of the students (AOR = 12.45 (95% CI: 1.7, 14.6)) and frequency of fruit (AOR = 0.76, 95% CI (0.7, 0.8)) and vegetable consumptions (AOR = 0.51, 95% CI (0.47, 0.575)) were found to be significantly associated with fast food consumptions (p < 0.05).
Conclusion
In this study, of the total 90.4% number of fast food consumers. A chi-square test revealed that there was a significant (p-value=0.058) associations between BMI and fast food consumption among students of University of Hargeisa. Educational level of the students and frequency of fruit and vegetable consumptions were found to be significantly associated with fast food consumptions. Effort should be made to increase access to fast food-related information and counseling.
Article Information
- Received
- Accepted
- Published
Copyright © 2025 Solomon Gebretsadik Bereka, et al.
 This is an open-access article distributed under the terms of the Creative Commons Attribution License, which permits unrestricted use, distribution, and reproduction in any medium, provided the original author and source are credited.
Corresponding author: Solomon Gebretsadik Bereka, lecturer, School of Graduate Studies, University of Hargeisa, Hargeisa, Somaliland —
Competing Interests
The authors declare that they have no competing interests.
Funding
No grant obtained for this study.
Data Availability
Raw data is available based on request.
Acknowledgements
We thank all University of Hargeisa students who took a part in this study.
Citation:
Introduction
For the last several decades, lifestyle has remarkably changed, which caused us to change our food consumption 1, 2, 3 and consume food outside our home environment 4. Fast food is the food dispensed fast at an inexpensive restaurant, usually offering a limited menu of cheap items, many of which may not be nutritious; the food can be eaten on-premises, taken out, or sometimes delivered 5. Mostly consumed fast foods include pizza, burger, fried chicken, chips, and French fries. Students and teens are the primary consumers of fast food, and the scenario is all the same around the globe because fast food is partially inexpensive, convenient, and fast.
Worldwide, overweight and obesity are at a rise both in developed as well as developing nations which affecting all ages, sexes and races 6. In developing nations since the past two decades, a threefold rise in obesity is observed because of the adoption of a more urbanized lifestyle combined with high calorie intake and a sedentary way of life7. Fast food consumption is one of the factors which have been reported as a cause of obesity8. University students were exposed to unhealthy habits for many motivations during their study years, increasing their risk of physical problems 9, 10.
BMI is a measure of how appropriate a person’s weight, is for his/her height. Based on BMI, obesity is divided into different classes; normal range (18.5 24.9), below normal range (< 18.5), pre-obesity (25-29.9), obesity class I (30-34.9), obesity class II (35-39.9), obesity class III (above 40) 11.
Fast food consumption is one of the factors which have been reported to cause obesity. Fast food is a specific variety of convenience food which is commonly associated with a high energy density; yet, there has been ambiguity in the definition of fast food in the existing empirical research 12. The factors which influence fast food consumption are convenience, costs and menu choices 13 and flavor and taste 14 Restaurant and fast food consumption, large portion size and beverages with sugar are positively associated with overweight and obesity 15, 16, 17.
Conversely, low–energy- dense foods, fruits and vegetables and a healthy breakfast are negatively associated with overweight and obesity 18, 19. Hence, the main of this study was to assess fast food consumption and its association with overweight /obesity among undergraduate students of University Hargeisa.
Methods and Materials
Study Area and Period
The study was carried out from May 01 to July 20, 2023 at University of Hargeisa. It is a government owned University located in Hargeisa capital city of Somaliland .
Study design
The study used an institutional based cross-sectional study design to aassess fast food consumption and its association with overweight /obesity among undergraduate students of University Hargeisa, Somaliland.
Sample Size Determination
The required sample size for this study was determined by using a single population proportion formula n= with the assumptions of = 95%, P = 30.7%, d=5%P = 50%, q=1-p, 1-0.307=0.693, d=0.05, and our final sample size was 260 students.
Sampling Technique
The study participants were selected using a simple random sampling technique.
Data collection tools and procedures
For data collection, structured questionnaire was prepared based on review literatures and dig out from related studies. It was prepared by English than translated in to local language (Somali). Translated version questionnaire was pre-tested prior to the actual data collection on 5% of sample size. The questionnaire has several sections and it has separate component for the measurement of individual anthropometric data. The anthropometric data was taken by data collectors to measure weight and height using a stadiometer. Weight was measured with minimum clothing and no shoes. Each height and weight measurement was taken twice.
Data quality assurance
Detail training for data collectors and supervisor was given for one days by the principal investigator. Furthermore, the principal investigator and supervisor were supervising the data collectors daily and make frequent checks on the data collection process and data were submitted `15 on daily basis to ensure the completeness and consistency of the gathered information. Any errors, ambiguity, incompleteness encountered were addressed on the following day before starting next day activities. Consistency was checked by re-translating the Somali version back to English by another individual who is expertise in both languages.
Data Processing and Analysis
Data was entered and checked for errors using EPI-info version 7.1.5.0 and then, data were exported to statistical package for social sciences (SPSS) software version 21 and STATA software version 14 for data processing and analysis. The data was cleaned and edited before analysis. Data exploration was undertaken to saw if there codes or items that was not be logical and then subsequent editing was made. Descriptive statistics such as; frequencies, means and proportion was used for present the findings. A bivariable and multivariable logistic regression analysis was conducted. Variables with P-values of less than 0.25 in the binary logistic regression analysis was entered into a multivariable logistic regression analysis to identify the independent predictors of fast food consumption. Both COR and AOR with corresponding 95% CI was computed to show the strength of the association. Finally, variable at P-value less than 0.05 in multivariable logistic regression analysis was considered as a statistically significant variable.
Result
Socio-demographic characteristics of Students of University of Hargeisa
The finding of this study showed that majority of the study participants (59.6%) who had taken fast food consumption were ranged from 21-25 years old, compared to (40.4%) those whose age between 26-42 years old. The results of this study indicates that majority of respondents (60.4%)%) who had taken fast food consumption were females, compared to (36.2%)who were male. This findings show that the most of respondents (32.8%) who had taken fast food consumptions were first year level, compared to more than above four years (20.0%). student in the 1st year group responded to the study indicates are highest consumers for fast food, there is statistical association between educational level of the respondents and having fast food consumption (p 0.020) (Table 1).
Table 1. Socio-demographic characteristics of Students of University of Hargeisa (n=235)| Variable | Category | Fast food consumption | p value | |
|---|---|---|---|---|
| Consume | Non consume | |||
| Age | 21-25 26-42 | 140(59%) 95(40.4%) | 18(72.0%) 7 (28.0%) | 0.226 |
| Gender | Male Female | 93(39.6%) 142(60.4%) | 7(28.0%) 18 (72.0) | 0.258 |
| Student university years | 1st year 2nd year 3rd year 4th year Additional or above | 85(36.2%) 53(22.6%) 29(12.3%) 21(8.9%) 47(20.0%) | 6(24.0%) 5(24.0%) 9(36.0%) 3(12.0%) 2(8.0%) | 0.020** |
| Father education level | Unable read or write Informal read /write Primary Secondary Collage and above | 40(17.0%) 48(20.4%) 17(7.2%) 53(22.6%) 77(32.8%) | 8(32.0%) 3(12.0%) 3(12.0%) 3(12.0%) 8(32.0%) | 0.248 |
| Mother education level | Unable read or write Informal read /write Primary Secondary Collage and above | 59(21.5%) 67(28.5%) 32(13.6%) 52(22.1%) 25(10.6%) | 4(16.0%) 9(36.0%) 3(12.0%) 3(12.0%) 6(24.0%) | 0.22 |
| Living with | Parents Relatives | 208(88.5%) 27(11.5%) | 21(84.0%) 4(16.0%) | 0.133 |
| Family type | Nuclear Joint | 175(74.5%) 60(25.5%) | 22(88.0%) 3(12.0%) | 0.508 |
| Monthly pocket money | Yes No | 99(42.1%) 136(57.9%) | 4(16.0%) 21(84.0%) | 0.011** |
Prevalence of fast Food Consumption among Students of University of Hargeisa
In this study, the majority 235 (90.4%, CI: 86.5- 93.8) of the study participants was fast food consumers. Only 25 (9.6%) of them haven’t use fast foods (Figure 1).
Figure 1. Frequency of fast food consumers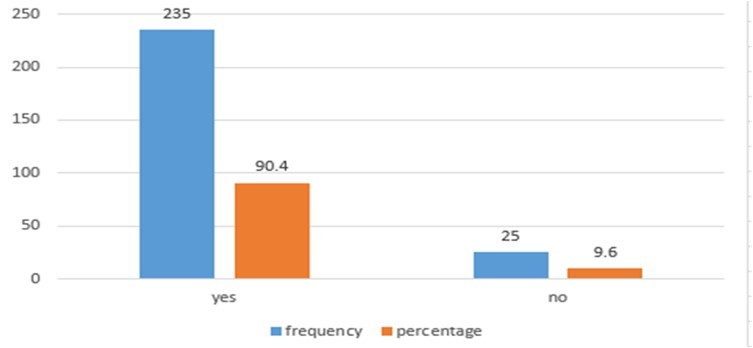
Download figure
Fast Food Consumption related factors of Students of University of Hargeisa
Of the total study participants 111(47%),62(26.4%),18(7.7%), 18(7.7%) of students consumed fast food, sometimes, always, mostly , and often, respectively. Regarding with number of days fast food consumed per week, 70 (29.8%),91 (38.7%) , 42 (17.9%) and 18(7.7%) were consumed fast food on an average for 1-2 days, 2-3 days, 3-4 days and more than 4 days per week respectively. Related with reason to ate fast food, 22(9.4%),130(55.3%),12 (5.1%),63(26.8%),123(52%) frequently eat fast food because it is simpler and quicker to prepare , better tastes, a less expensive cost, easier accessibility, and do not have a source of fast food at home respectively (Table 2).
Table 2. Fast Food Consumption related factors| Variables | Fast food consumption | Total | P value | |
| Consume % | Non consume % | |||
| Types of fast food per week Always Mostly Often Sometimes | 62 26.4% 18 7.7% 44 18.7% 111 47.2% | 3 12.0% 4 16.0% 7 28.0% 11 44.0% | 65 25.0% 22 8.5% 51 19.6% 112 46.9% | 0.19 |
| When do you consume fast food frequently? While traveling While studying While alone While friends Only specific occasion | 34 14.5% 23 9.8% 46 19.6% 120 51.1% 12 5.1% | 3 12.0% 3 12.0% 2 8.0% 13 52.0% 4 16.0% | 37 14.2% 26 10.0% 48 18% 133 51.2% 16 6.2% | 0.877 |
| When you usually consume fast food a day? Morning /breakfast Afternoon/ lunch time Evening /dinnertime No specific time | 57 24.3% 22 9.4% 73 31.1% 83 35.3% | 7 28.0% 2 8.0% 6 24.0% 10 40.0% | 64 24.6% 24 9.2% 79 30.4% 93 35.8% | 0.148 |
| Where did you consume fast food? At home At university At restaurant At friend house At street food | 46 19.6% 65 27.7% 79 33.6% 44 18.7% 1 0.0% | 1 4.0% 18 72.0% 3 12.0% 3 12.0% 0 4.0% | 47 18.1% 83 31.9% 82 31.5% 47 18.1% 1 0.4% | 0.000** |
| Main reason eats fast food Its quicker to make easy Its taste better It’s cheaper prize Easy available Favorite leisure time activity | 22 94% 130 55.3% 12 5.1% 63 26.8% 8 3.4% | 4 16.0% 10 40.0% 4 16.0% 7 28.0% 0 0.0% | 26 10.0% 140 53.8% 16 6.2% 70 26,9% 8 3.1% | 0.126 |
| Family member eat fast food? Yes No | 173 73.6% 62 26.4% | 17 68.0% 7 28.0% | 190 73.1% 69 26.5% | 0.009** |
| Did went avoid fast food Consumption? Yes No | 159 67.7% 76 32.3% | 19 76.0% 6 24.0% | 178 68.5% 82 31.5% | 0.394 |
| Did you find nutritional value fast food? High Low Acceptable | 42 17.9% 71 30.2% 122 51.9% | 4 16.0% 7 28.0% 14 56.0% | 46 17.7% 78 30.0% 136 52.3% | 0.926 |
| Did you consider fast food healthy? Yes No | 87 37.0% 148 63.0% | 7 28.0% 18 72% | 94 36.2% 166 63.8% | 0.372 |
Magnitude of nutritional status among Students of University of Hargeisa
In this study anthropometric measurements (height and weight) were taken to assess the student’s nutritional status. Body mass index (BMI) was calculated as weight divided by height square. Based on BMI, obesity is divided into different classes; normal range (18.5 24.9), below normal range (< 18.5), pre-obesity (25-29.9), obesity class I (30-34.9), obesity class II (35-39.9), obesity class III (above 40). Hence, the study revealed that, from the total study participants 46(17.7%),127(48.8%),84(32.3%), 3(1.2%) were underweight, normal, overweight and obese respectively (Table 3).
Table 3. Prevalence of underweight, normal weight, overweight and obese of University of Hargeisa Students, Hargeisa, Somaliland, 2023 (n=260)| Categories | Frequency | Percent |
| Underweight | 46 | 17.7 |
| Normal weight | 127 | 48.8 |
| Overweight | 84 | 32.3 |
| Obese | 3 | 1.2 |
Association between Body mass index categories result with fast food consumption
A chi-square test was performed to assess if there is an association between categories of BMI and fast food consumption. The result revealed that there was a significant (p-value=0.058) associations between BMI and fast food consumption among students of University of Hargeisa (Table 4).
Table 4. Association between BMI and fast food consumption| Fast Food Consumption | Underweight | Normal weight | Overweight | Obese | Chi-square test |
|---|---|---|---|---|---|
| No | 2 | 11 | 12 | 0 | 0.058 |
| -0.80% | -4.20% | -4.60% | 0.00% | ||
| Yes | 44 | 116 | 72 | 3 | |
| -16.90% | -44.60% | -27.70% | -1.20% | ||
| Total | 46 | 127 | 84 | 3 | |
| -17.70% | -48.80% | -32.30% | -1.20% |
Multivariate logistic regression for the factors associated with fast food consumption
The bi-variable logistic regression analysis result revealed that the student’s educational level (p = 0.02), student’s pocket money (p = 0.011), where the students consume fast foods (p ≤ 0.001), family members eating fast foods (p = 0.009), fruit and vegetable consumption (p = 0.002), nutritional problem managements (p = 0.038), community knowledge about nutrition (p = 0.011) were significantly associated (p-value<0.25) with fast food consumption. On multi-variable logistic regression model educational level of the students and frequency of fruit and vegetable consumptions were found to be significantly associated with fast food consumptions (p < 0.05).
It was observed that student’s educational level was positively associated with fast food consumption. For the student of the third year were 12 times more likely to consume fast foods compared to postgraduate level students AOR = 12.45 (95% CI: 1.7 14.6). The study also revealed that, frequency of fast food consumption was negatively associated fast food consumption. In contrast, consumption of moderate and often fruit and vegetables per week increases the likelihood of fast food consumption by 24% and 49% respectively, AOR = 0.76 95% CI (0.7 0.8), AOR = 0.51 95% CI (0.47 0.575) (Table 5).
Table 5. Logistic regression analysis| Variable | Categories | Fast food consumption | AOR (95% CI) | P value | |
|---|---|---|---|---|---|
| Consume | Not consume | ||||
| Student’s educational level | 1st year | 85 (36.2%) | 6 (24.0%) | 3.127 (0.477, 20.484) | 0.253 |
| 2nd year | 53 (22.6%) | 5 (24%) | 2.256 (0.331, 15.396) | 0.406 | |
| 3rd year | 29 (12.3%) | 9 (36%) | 12.45 (1.7, 14.6) | 0.013 | |
| 4th year | 21 (8.9%) | 3 (12%) | 1.295 (0.132, 12.71) | 0.825 | |
| Additional | 47 (20%) | 2 (8%) | 1 | — | |
| Frequency of fruit consumption per week | 1–2 days in week | 123 (52.3%) | 20 (80.0%) | 1 | — |
| 3–4 days in week | 47 (65%) | 25 (35%) | 0.76 (0.7, 0.8) | 0.036 | |
| 5–6 days in week | 22 (64.0%) | 12 (36%) | 0.51 (0.47, 0.57) | 0.008 | |
| 7 days or more in week | 8 (3.4%) | 3 (12.0%) | 3.077 (0.3, 31) | 0.341 |
Discussion
In this study, prevalence the majority 235 (90.4%, CI: 86-93.8) of the study participants was fast food consumers. The findings of this study was lower than the study done in Saudi Arabia (97%)20. However, the findings of this study was less than prevalence of fast food consumption that point prevalence of fast food intake was 89%21. This could be due to differences of socio-cultural status, socioeconomic and living situations indicates .
The prevalence of fast food consumption among university students in Lebanon was (16.8%) prevalence reported in. The percentage of those who consume fast food more than twice a week (47.1%) was lower than the 66.5% reported, among female students in Saudi Arabia and similar to (41.3%) study but the female students in King Saudi University22.
The study revealed that, educational year of student (p-0.020) and consumption of fruits and vegetables (p-0.002) were significantly associated with fast food consumption. The study also showed that, their significant relationship between frequency eating fruits and vegetables consumption and eating fast food. The finding is similar with a study done in turkey findings indicates a statistically significant relationship between the frequency of fast-food consumption and amount of vegetables consumed daily and the habit of eating breakfast with fast food consumption23.
Conclusion
In this study, there were a high 90.4% number of fast food consumers. A chi-square test revealed that there was a significant (p-value=0.058) associations between BMI and fast food consumption among students of University of Hargeisa. Educational level of the students and frequency of fruit and vegetable consumptions were found to be significantly associated with fast food consumptions. Effort should be made to increase access to fast food-related information and counseling.
Limitation of the study
This study was conducted to assess fast food consumption and its association with overweight/obese among University of Hargeisa students. It would be great if we also add qualitative method of data collection.
Author Contribution
MA: drafting proposal, data collection, data entry, data coding, draft data analysis. SG: editing draft manuscript preparation, advanced data analysis, methodology review.
Declarations
Ethics approval and consent to participate
The University of Hargeisa's Graduate Studies School provided ethical clearance. Each participant received a brief explanation of the study's objectives before to enrollment, and they all verbally consented to participating. At every stage of data collection and processing, anonymity and confidentiality were maintained.
References
- 1.T Van Strien. (2018) Causes of emotional eating and matched treatment of obesity. Curr Diab Rep. 18, 35.
- 2.Havermans R C, Vancleef L, Kalamatianos A, Nederkoorn C. (2015) Eating and inflicting pain out of boredom. Appetite. 85-52.
- 3.Panahi S, Tremblay A. (2018) Sedentariness and health: Is sedentary behavior more than just physical inactivity? Front Public Heal. 6-258.
- 4.Renzo L D, Gualtieri P, Pivari F, Soldati L, Attinà A et al. (2020) Eating habits and lifestyle changes during COVID-19 lockdown: An Italian survey. J Transl Med. 18, 229.
- 5.Krishna G R, Somavarapu S. (2017) Preference for restaurant foods over home made. , Res Rev J Food Sci Technol 3, 32-48.
- 7.B M Popkin, L S Adair, S W Ng. (2012) Global nutrition transition and the pandemic of obesity in developing countries. , Nutr. Rev 70, 3-21.
- 8.Shah T. (2014) Assessment of obesity, overweight and its association with the fast food consumption in medical students." Journal of clinical and diagnostic research:. , JCDR 8(5), 05.
- 9.Leslie E, Owen N, Salmon J, Bauman A, J F Sallis et al. (1999) Insufficiently active Australian college students: perceived personal, social, and environmental influences. 20–27, https://doi.org/10.1006/ PMED.1998.0375 , Prev Med (Baltim) 28.
- 10.M C Nelson, Story M, N I Larson, D. (2008) Emerging adulthood and college-aged youth: an overlooked age for weight-related behavior change. , Obesity (Silver Spring) 16, 2205-2211.
- 11.Alfawaz H A. (2012) The relationship between fast food consumption and BMI among university female students. Pak Jn of Nutri. 11(5), 406-10.
- 12.Kapica C D, Alexander P M, Butchko H. (2006) The definition of fast food in published studies. The FASEB Journal. 20-189.
- 13.Driskell J A, Meckna B R, Scales N E. (2006) Difference exist in the eating habits of university men and women at fast food restaurants. Nutrition Research. 26(10), 524-30.
- 14.Brynat R, Dundes L. (2008) Fast food perception: A pilot study of college students in Spain and United State. Apetite. 51(2), 327-30.
- 15.Duffey K J, Gordon-Larsen P, Jacobs D R, Williams O D, Popkin B M. (2007) Differential associations of fast food and restaurant food consumption with 3-y change in body mass index: the Coronary Artery Risk Development in Young Adults Study. Am J Clin Nutr. 85.
- 16.Rolls B J, Roe L S, Meengs J S. (2006) Larger portion sizes lead to a sustained increase in energy intake over 2 days. ParTiCularS oF ConTriBuTorS: [8] [9] , J Am Diet Assoc 106-543.
- 17.Berkey C S, Rockett H R, Field A E, Gillman M W, Colditz G A. (2004) Sugar-added beverages and adolescent weight change. Obes Res. 12, 778-88.
- 18.He K, Hu F B, Colditz G A, Manson J E, Willett W C et al. (2004) Changes in intake of fruits and vegetables in relation to risk of obesity and weight gain among middle aged women. Int J Obes Relat Metab Disord. 28, 1569-74.
- 19.Keski Rahkonen A, Kaprio J, Rissanen A, Virkkunen M, Rose R J. (2003) Breakfast skipping and health compromising behaviors in adolescents and adults. , Eur 57, 842-53.
- 20.Kazi R N A. (2020) Prevalence of salt rich fast food consumption: A focus on physical activity and incidence of hypertension among female students of Saudi Arabia."Saudi. , Journal of Biological 27(10), 2669-2673.
- 21.Habib A. (2016) Prevalence, Determinants and Consequences of Fast-Food Consumption among college students in Abha-Aseir.