
Anatomical Structure of the Umbilical Cord in Sudanese and Correlation with Neonatal Outcome
Abstract
Background
The neonatal morbidity and mortality is very high in the Sudan, the umbilical cord association and contribution to this is planned to be answered. Therefore the present study was designed to provide some information on the morphological variations of human umbilical cord via gross anatomical assessment and their correlation with foetal factors such as foetal weight and length.
Methods
A prospective hospital - based study conducted in Wad Madani Maternity Teaching Hospital Department of Obstetrics and Gynecology between July 2014 and March 2018
Results
The mean diameter of the 371 umbilical cords was 2.1±0.24cm. Length was 53.8±3.8 cm length ranging from 48 – 62 cm and 10 (2.7%) of 371 umbilical cords were uncoiled. of which, 1 (0.3%) cords were with absent Wharton’s Jelly. The mean neonatal indices were 2.95 kg, 33.19 cm and 44.42 cm for weight, head circumference and length respectively. There was just significant strong positive correlation between umbilical cord length and length of neonates. Also Umbilical cord diameter had a positive correlation with length of neonates and negative correlation with weight of neonates and APGAR Score.
Conclusion
The present study suggests that ‘normal’ cord length should be between 40 cm and 70 cm in length. Umbilical cord diameter had a positive correlation with fetal length and negative correlation with fetal weight and APGAR score. The diameter range of 1-2 cm suggests that a normal cord must not exceed 2 cm in diameter. However the umbilical cord index had negative correlation with length of neonates.
Author Contributions
Academic Editor: Manal ElSawaf, anta University, al-Gaish Street, Tanta, Gharbia, Egypt.
Checked for plagiarism: Yes
Review by: Single-blind
Copyright © 2021 Motaz Ahmed Abdelrahman NuggedAlla, et al.
 This is an open-access article distributed under the terms of the Creative Commons Attribution License, which permits unrestricted use, distribution, and reproduction in any medium, provided the original author and source are credited.
Competing interests
The authors have declared that no competing interests exist.
Citation:
Introduction
It is estimated that more than 7.6 million perinatal deaths occur each year worldwide; 4.3 million of these are foetal deaths 1. Ninety-eight percent of perinatal deaths have been said to take place in developing countries, and the perinatal mortality rate is estimated to exceed 55 per 1000 births, which is five times higher than in developed countries 2. The occurrence of foetal compression risk based on umbilical cord location and placental malformations are also unknown 2, 3. After about four weeks of gestation the only link of the foetus to the placenta is the umbilical cord which begins to form around this time replacing the yolk sac. It develops from the extra embryonic mesoderm and becomes the channel for blood vessels, through which all exchanges and other activities of the mother and the foetus via the placenta are carried out. It is a cylindrical structure made up of a single layer of amniotic epithelium within which are two arteries and one vein embedded in a gelatinous ‘Wharton’s jelly’ which is mainly a mucopolysaccharides 4. At term the normal umbilical cord is about 55-65 cm in length with a diameter of 2.0-2.5 cm which normally insert centrally or eccentrically on the foetal side of the placenta 2. The umbilical cord is the mean by which oxygen, carbon dioxide, steroids and other products are carried to and from the foetus, and it also allows free movement of the foetus within the uterus and protects the umbilical blood vessels from mechanical injury 5. Due to its peculiar role of being the link between the placenta and the foetus, any abnormality of this cord, be it in the length, the amount of Wharton’s jelly, number of vessels or its amniotic epithelium may lead to abnormal foetal outcome 6. The study. It aimed to assess the morphological study on placenta and its relation to the neonatal outcomes.
Materials and Methods
Study Design
This is a prospective hospital - based study conducted in Wad Madani Maternity Teaching Hospital Gezira State.
Sample Size and Study Population
This study on the umbilical cord and placenta of 371 neonates who born in the Wad Madani Maternity Teaching Hospital during the period of the study during the period of the study (between July 2014 and March 2018), all these were included criteria. Sample size was calculated according to the following equation formula (7):

n= is the sample size required
N= is the whole target population in question
P= is the average proportion of records expected to meet the various criteria (1-p) is the average proportion of records not expected to meet the criteria
A= is the margin of error deemed to be acceptable
c= is a mathematical constant defined by the Confidence Interval chosen
Data collection:-
Data has been classified into following three categories:
1. Maternal
2. Umbilical cord
3. Neonate details
Maternal details: Maternal details obtained from the case sheets of enrolled subjects, are as follows. Name (for file only), Hospital number, Age, LMP, EDD and term of gestation and Obstetric history.
Umbilical cord: Placental details collected as below:
(A) Umbilical cord diameter measured by Digital Gauge Vernier Calliper.
(B) Umbilical cord lengths measured by plastic meter.
Umbilical cords were collected immediately after the delivery and examined within 30 minutes after delivery. Then, they were measured immediately then washed well with running tap water to remove the blood clots. Gross morphological features, length and diameter of umbilical cord were noted.
Neonate details: The neonate details includes date of delivery (DOD), gender, APGAR Score at 1 minute and 5minutes, total length (Height), head circumference in centimeters, weight in Kilograms and anomalies if present were recorded from neonate’s file immediately followed by the delivery. All the neonates followed up for their hospital stay to rule out anomalies. Newborn’s birth weight < 2.5 Kg, 2.5 to 3.8 Kg and > 3.8 Kg has been considered as low birth weight, normal birth weight and large for gestational age (LGA) respectively. On the other hand gestational age (GA) less than 37 weeks has been considered as preterm, 37 to 42 weeks as term and more than 42 weeks was post term.
Data Analysis
Data was analyzed by statistical package for social science (SPSS). Data was displayed by tables and histogram.
Results
Among 371 umbilical cords10 (2.7%) of were uncoiled Figure 1. (3.6) and 1 (0.3%) cords were with absent Wharton’s Jelly Figure 2. The mean diameter of the 371 umbilical cords was 2.1±0.24cm. Length was 53.8±3.8 cm length ranging from 48 – 62 cm as Table 1.
Figure 1.Uncoiled umbilical cord
Figure 2.Absence of Wharton's jelly in umbilical cord
| Variables | Minimum | Maximum | Mean | Std. Deviation |
| Diameter of the umbilical cord(cm) | 1.9 | 2.5 | 2.1 | 0.2 |
| Length of the umbilical cord(cm) | 48 | 62 | 53.8 | 3.8 |
The mean gestational age of 371 neonates was 38 weeks ± 1.5 week. 138 (37.2%) were Preterm. APGAR score at 1 min and 5 min was 7, 8, 9 and 10 out of 10. Mean weight of 371 neonates was 2.9 ±.5 kg with 33.1±1.5 cm head circumference and 44.4±7cm of total length of the neonates. (Table 2).
Table 2. Descriptive statistics of Newborn| Variables | Min | Max | Mean | Std. Dev |
| Gestational Age | 34 | 40 | 37.9704 | 1.50555 |
| APGAR Score | 7 | 10 | 8.9111 | .69761 |
| Weight of Neonates (Kg) | 1.8 | 3.7 | 2.9480 | .50667 |
| Head Circumference (cm) | 30 | 37 | 33.1887 | 1.50745 |
| Length of Neonates (cm) | 31 | 55 | 44.4488 | 7.35353 |
In measure of neonates there were 72 (19%) were Low Birth Weight neonates (LBW). The mean birth weight of 371 neonates was 2.95±.5 Kg. Figure 3.
Figure 3.Weights of Neonates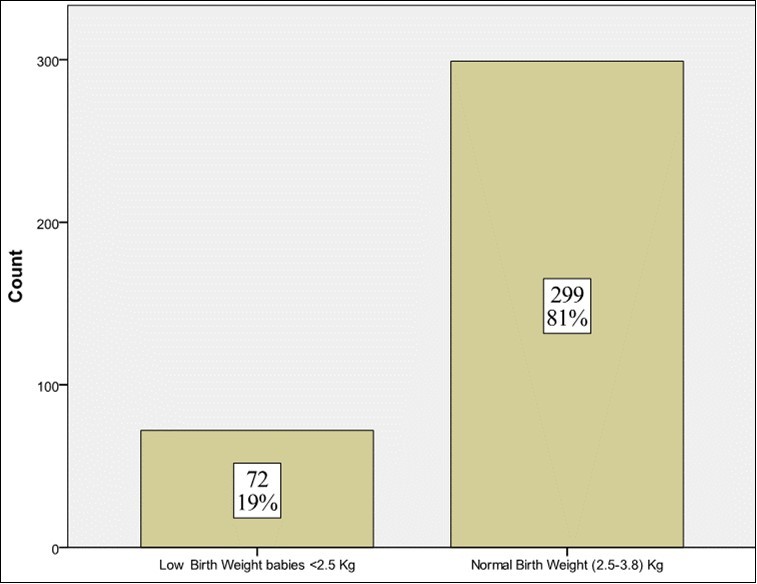
When umbilical cord parameters and neonatal outcomes were analyzed with Pearson’s correlation to find out the association between them, There was just significant strong positive correlation (r) between umbilical cord length (M=53.8 SD= 3.8 cm) and length of neonates (M=44.4 SD=7cm),(r= 0.72, p = 0.000). Increased umbilical cord length was associated with increased fetal length.
Umbilical cord diameter (M=2.1 SD=0.24cm) had a positive correlation with length of neonates (M=44.4 SD=7cm), (r= 0.45, p = 0.000) and negative correlation with weight of neonates (M=2.9 SD=.5 kg), (r= - 0.32, p = 0.000) and APGAR Score (M=8.9 SD=.5), (r= - 0.15, p = 0.05). That mean increased umbilical cord diameter is associated with increased fetal length and decreased fetal weight and their APGAR score. (Table 3)
Table 3. Correlation between umbilical cord variables and neonatal outcome| AS | WN | HC | LN | ||
| Length of UC | Pearson Correlation | .027 | -.012 | .044 | .724** |
| Sig. (2-tailed) | .600 | .815 | .398 | .000 | |
| Diameter of UC | Pearson Correlation | -.146** | -.319** | -.008 | .453** |
| Sig. (2-tailed) | .005 | .000 | .877 | .000 | |
Discussion
In the present study, the minimum cord length was 48 cm and the maximum was 62 cm with a mean of 53.81 cm ± 3.82. There was just significant strong positive correlation (r) between umbilical cord length (M=53.8 SD= 3.8 cm) and length of neonates (M=44.4 SD=7cm), (r= 0.72, p = 0.000). The categorization of umbilical cords in the present study was based on previous studies. Umbilical cords less than 40 cm in length were considered short and between 40 cm to 70 cm were classified as normal with those longer than 70 cm being long. The present study showed that all the lengths of the umbilical cord in the normal range.
Although reference standards for the length of the umbilical cord have been reported, variations exist in the classification of short and long umbilical cords 5, 8, 9, 10. Classically, the umbilical cord continues to grow in length until birth with majority of umbilical cords nearly equally the same in length as the neonate. An observation made by Benirschke 11 showed that human umbilical cords develop steadily with growing gestation and foetal crown-rump length; and measures approximately 55 cm long at term with human neonates exhibiting wider variations in terms of the length of their umbilical cords. Results of several studies support this finding 12, 13. In spite, of these reports which try to address the issues of umbilical cord development, the control mechanisms of the length of the umbilical cord are still unclear 11.
The mean umbilical cord diameter in this study was 2.12 ± 0.24 cm with a range of 1.9 - 2.5 cm. The umbilical cord diameters obtained in the present study were different to the findings of Collins 160 who reported an average diameter of a normal cord to be 1.2 cm, it also appeared (1.2 and 1.4 cm) observed in another studies 14, 15. However, about 86.44% of the cords had diameters ranging from 1.0 cm to 2.0 cm. Based on previous studies by Eze et al. 15 and Collins 16, the mean umbilical cord diameter of 2.12 cm obtained in the present study appears to be within the normal range. Limitations of the study include that only the umbilical cord itself was investigated. Hegazy 17 stated that the anomalies of the cord include also its attachment to the fetal body such as omphalocele as well as its insertion in the placenta including eccentric, marginal and membranous insertions.
Conclusion
The present study suggests that ‘normal’ cord length should be between 40 cm and 70 cm in length. Umbilical cord diameter had a positive correlation with fetal length and negative correlation with fetal weight and APGAR score. The diameter range of 1-2 cm suggests that a normal cord must not exceed 2 cm in diameter. However the umbilical cord index had negative correlation with length of neonates.
References
- 2.Salafia C, A M Vintziloes. (1999) Why all placentae should be examined by a pathologist. , American Journal of Obstetrics and Gynaecology 163(4), 1282-1293.
- 3.Valsamakis G, Kanaka-Gantenbein C, Malamitsi-Puchner A, Mastorakos G. (2006) Causes of intrauterine growth restriction and postnatal development of the metabolic syndrome. Annals of the New York Academy of Sciences. 1092, 138-147.
- 4.Kulkarni. (2007) Absence of Wharton's jelly around the umbilical arteries. Indian journal of pediatrics. 74, 787-9.
- 5.C S Abaidoo, K A Boateng, M A Warren. (2008) Morphological variations of the “baby’s supply line”. , Journal of Science and Technology 28(2), 1-9.
- 6.A K Leung, Robson W L. (1998) Single umbilical artery: a report of 159 cases. , AJDC; 143, 109-111.
- 7.Offredy M, Vickers P. (2010) . Developing a Healthcare Research Proposal (1sted.). Oxford: Wiley-Blackwell 131 .
- 10.J T Mutihir, S D Pam. (2006) Anthropometric and other Assessment indices of the Newborn of Jos. , Nigeria, Annals of African Medicine 5(4), 192-196.
- 12.Nnatu S. (1991) Length of human umbilical cords in an African population. , Journal of National Medical Association 83(1), 33-36.
- 13.Stefos T, Sotiriadis A, Vasilios D, Tsirkas P, Korkontzelos I et al. (2003) Umbilical cord length and parity--the Greek experience. , European Journal of Obstetrics and Gynaecology 107(1), 41-44.
- 14.E A Abdalla, C A Ayad, F A Eisa. (2014) Estimation of foetal age sonographically using umbilical cord diameter in second and third trimester. , American Journal of Health Research 2(2), 68-72.
- 15.C U Eze, M C Ugwuja, C U Eze, K, G O Ugwu. (2014) Relationship between sonographic umbilical cord size and gestational age among pregnant women in Enugu, Nigeria. African Health sciences. 14(2), 334-338.